Texas Manufactured Housing Market Report April 2026 - Sales Data & Analysis
Rob Ripperda
April
Early Look
New manufactured home sales for April 2026 titled to date are so far down a seasonally-adjusted 0.9% from the previous month but are running 8% above April of 2025 as the titling shift that has been underway since August of 2025 continues to inflate early reporting year-over-year comparisons.
Until we get through the summer of 2026, year-over-year numbers should remain high, especially for the early look.
As you can see in the plot below the early April sales counts are running above the previous years due to the titling cadence change, while the March 2026 total now trails all but 2022.
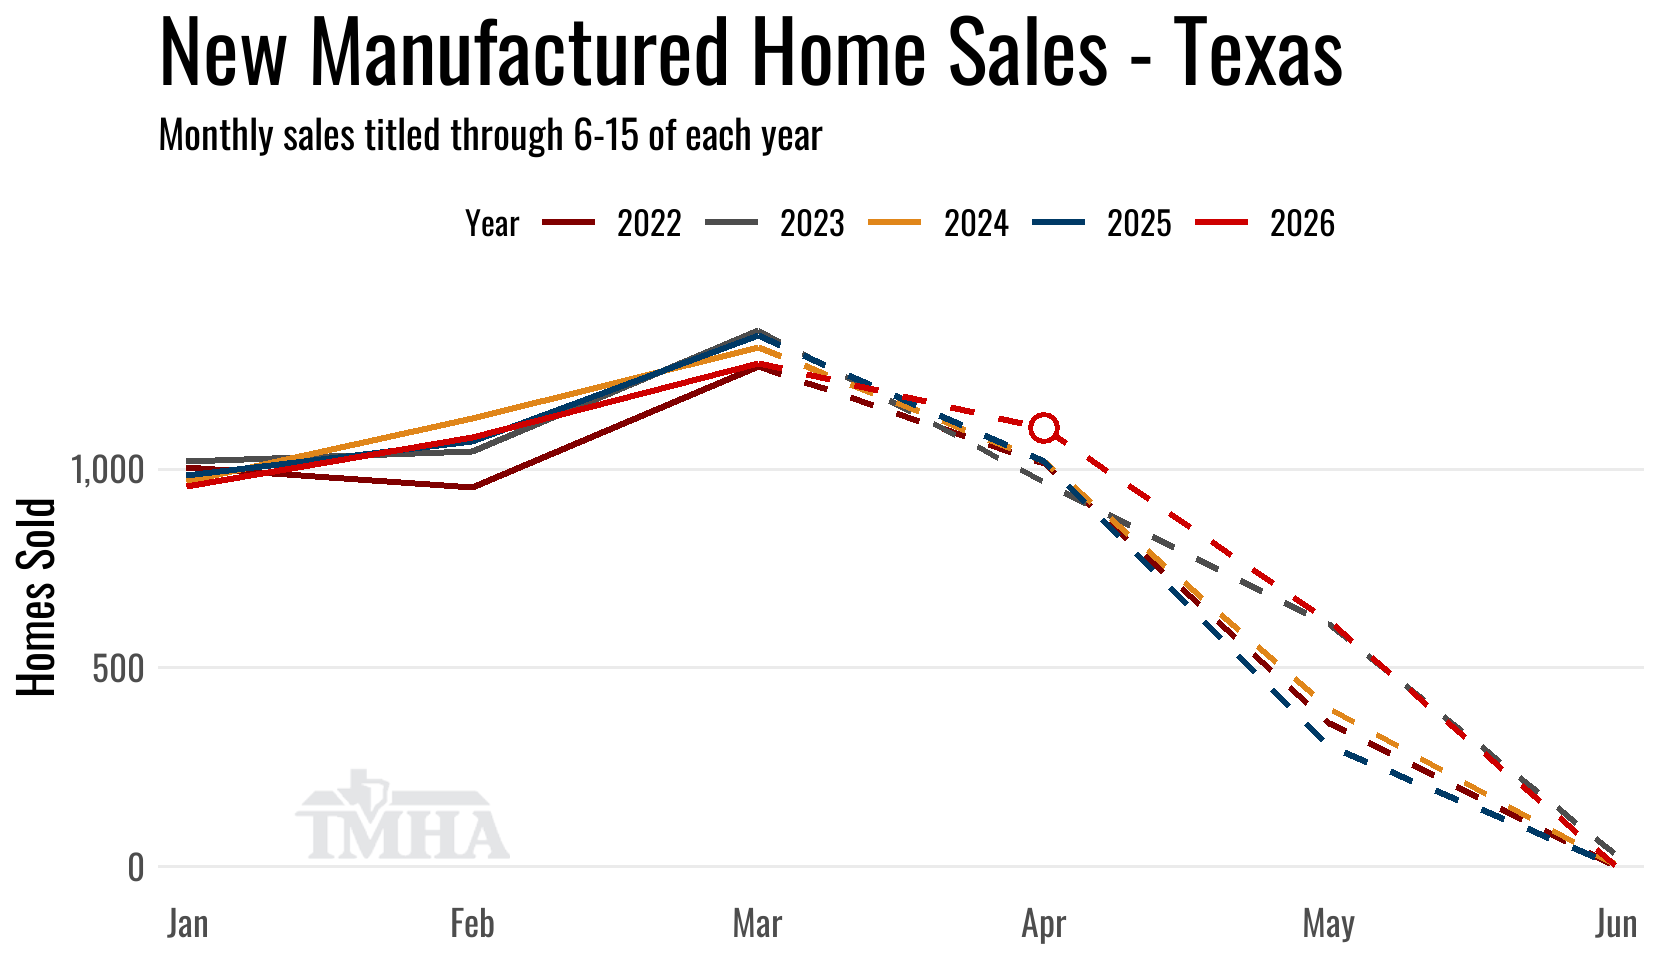
Solid lines represent months for which the on-time titling window has closed. Dashed lines are preliminary months for which titles are still being counted toward the reported total.
The comparisons in the table below are based on where the previous month’s numbers were when originally reported on one month ago.
| New Sales | Singles | Multis | Total |
|---|---|---|---|
| Total for April: | 377 | 725 | 1,102 |
| Change from March (Raw %): | -18.8% | -2.7% | -8.9% |
| Change from March (Raw Units): | -87 | -20 | -107 |
| Change from March (SA %): | -12.4% | 3.1% | -0.9% |
| Change from April of 2025 (%): | -11.3% | 21.8% | 8% |
| Change from April of 2025 (Units): | -48 | 130 | 82 |
TMHA Member’s Retailer Annual Sales Totals Report
March
Titled on Time
New home sales for March titled to date were down a seasonally adjusted 9% from the previous month and are down 5.4% on the raw total from March of 2025.
The 1,264 total homes sold marked the first report release since June of 2025 with a year-over-year decline and accentuated the seasonally adjusted under performance. Given the titling shift is still flattering year-over-year comparisons, this was a notable turn.
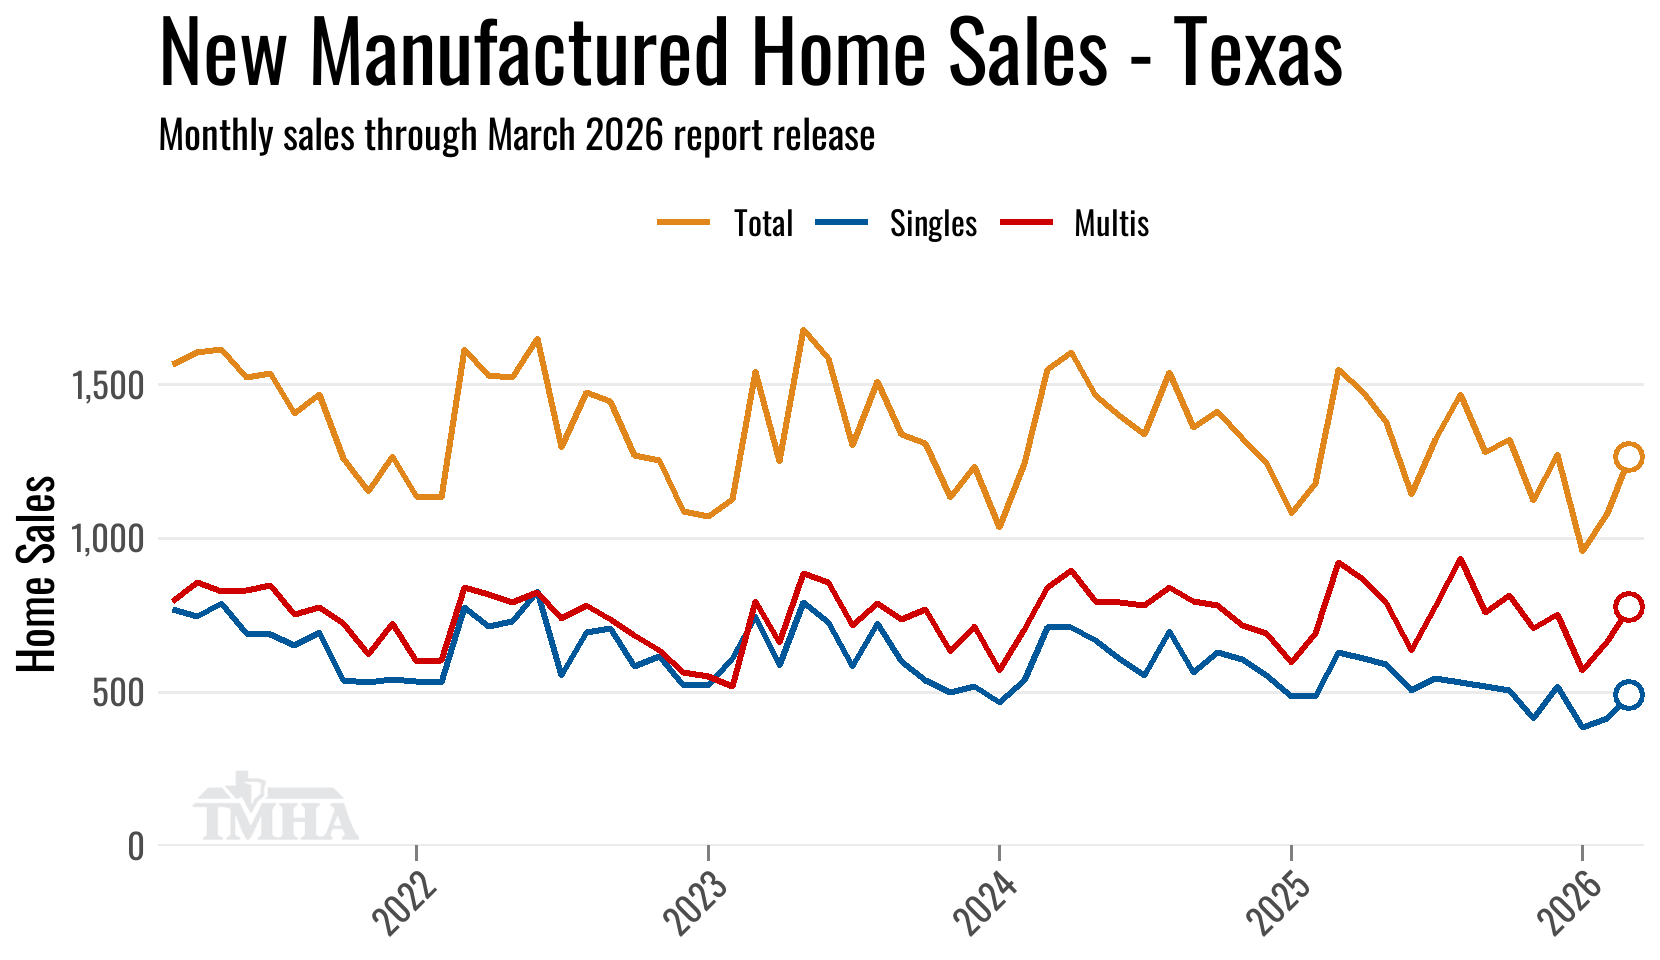
While the plot above contains revised totals for previous months the comparisons in the table below are based on where the previous month’s numbers were when released one month ago.
| New Sales | Singles | Multis | Total |
|---|---|---|---|
| Total for March: | 488 | 776 | 1,264 |
| Change from February (Raw %): | 20.5% | 18.8% | 19.5% |
| Change from February (Raw Units): | 83 | 123 | 206 |
| Change from February (SA %): | -5.9% | -7.6% | -9% |
| Change from March of 2025 (%): | -9.1% | -2.9% | -5.4% |
| Change from March of 2025 (Units): | -49 | -23 | -72 |
TMHA Member’s Retailer Monthly Sales Totals Report
Installation Location Trends
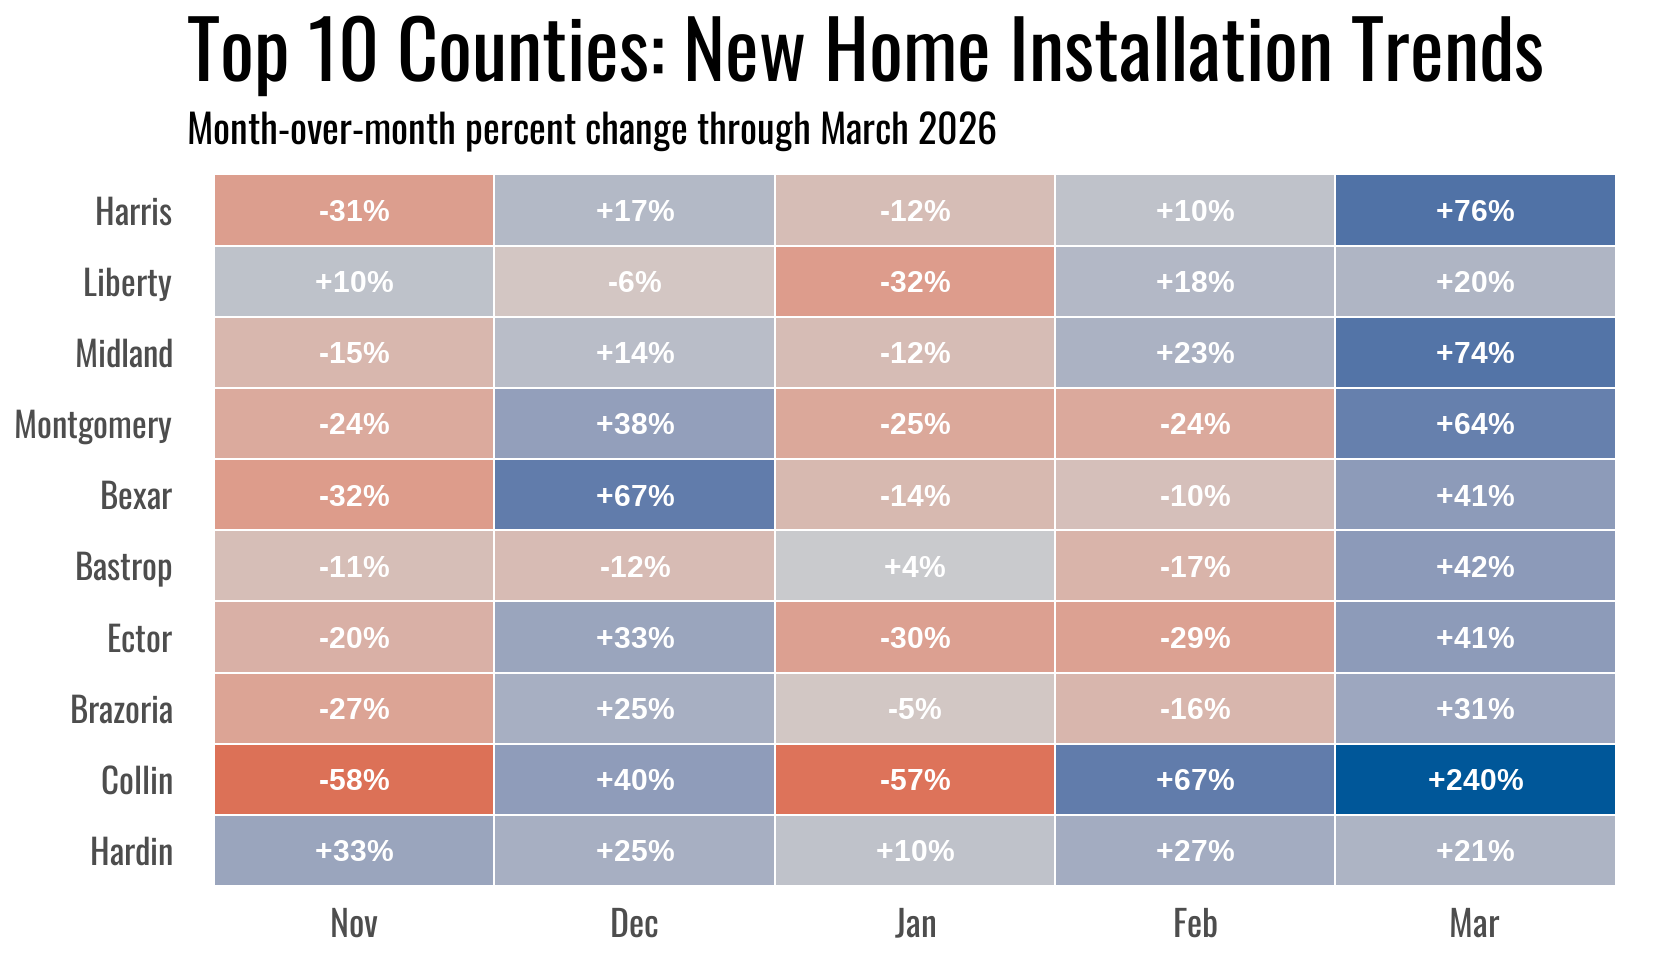
Here are the month-over-month changes for the top 10 counties for new home sales in March and their sequential changes over the previous four months.
Every county in the top ten posted a month-over-month gain in March. Harris led with a 25-unit increase, while Midland added 20 and Montgomery 16. Collin’s 17 sales more than tripled its February count.
TMHA Member’s Retailer Annual Sales Total per County Report
Annual Totals
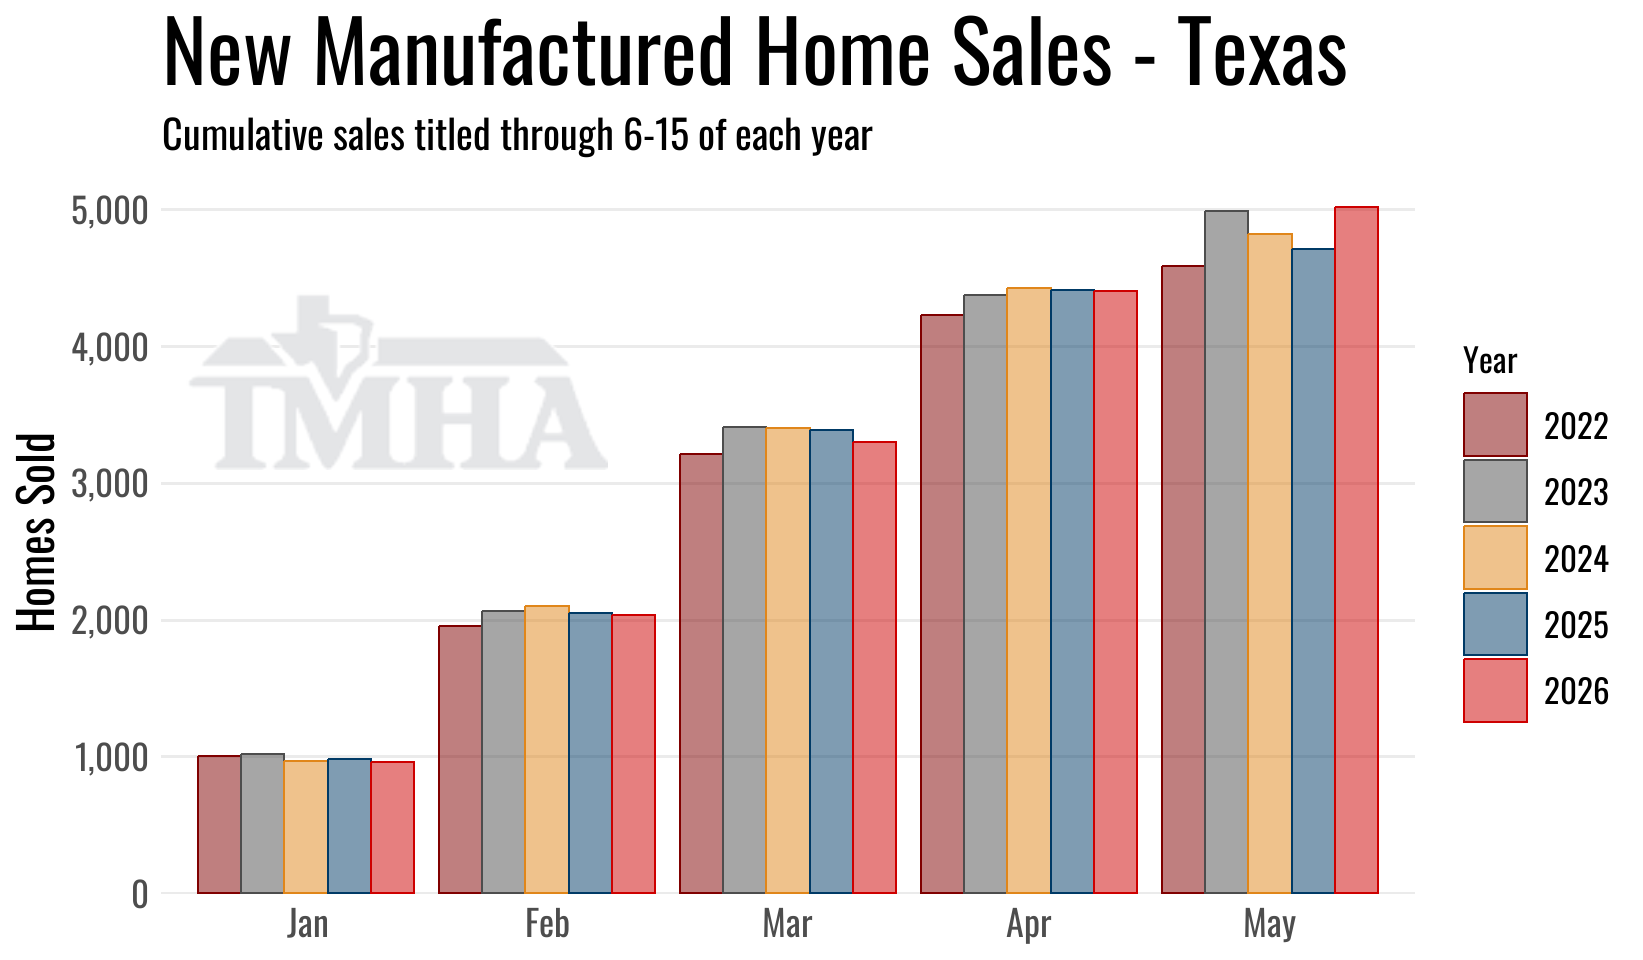
New home sales in 2026 are showing a 6.5% gain year-over-year for titles processed through this point compared to 2025.
Multi-section sales are up 13.6% year-over-year while single-section sales are down 3.4%.
As noted above, the titling phase shift continues to inflate 2026 year-over-year comparisons, particularly through this first half of 2026.
| New Sales | Singles | Multis | Total |
|---|---|---|---|
| Total for 2026 titled to date: | 1,891 | 3,131 | 5,022 |
| Change from 2025 (%): | -3.4% | 13.6% | 6.5% |
| Change from 2025 (Units): | -67 | 375 | 308 |
TMHA Member’s Retailer Annual Sales Totals Report
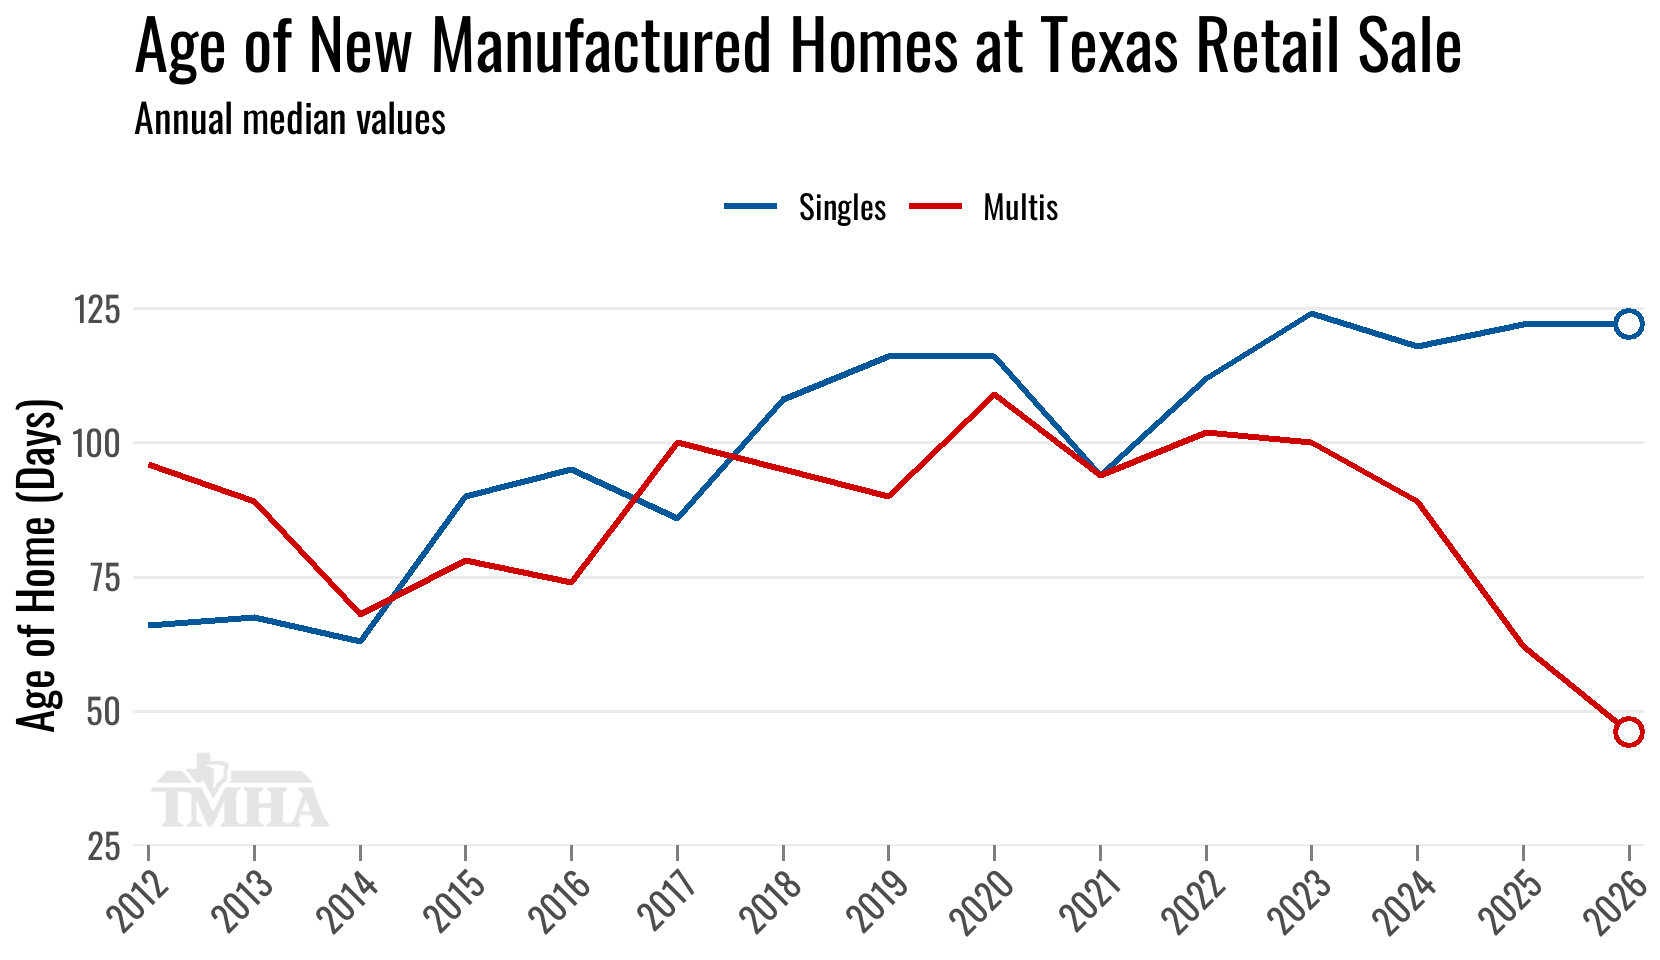
New Home Characteristics
The shift in title cadence has really pulled down the median age of multi-section homes to the shortest amount of days in our records, yet the same dynamic hasn’t carried over to single-section homes, whose median age remains near its 2023 peak. Given how much the median has moved for multi-section homes, we suspect the change in date of sale guidance had an outsized effect on those home sale transactions, but the single-section market has also underperformed the multi-section market for several years now, so it makes sense that they are taking longer to turn.
| New Home Characteristics for 2026 | Singles | Multis | Total |
|---|---|---|---|
| Median Age of Home (Days): | 122 | 46 | 68 |
| Median Square Footage: | 1,080 | 1,736 | 1,475 |
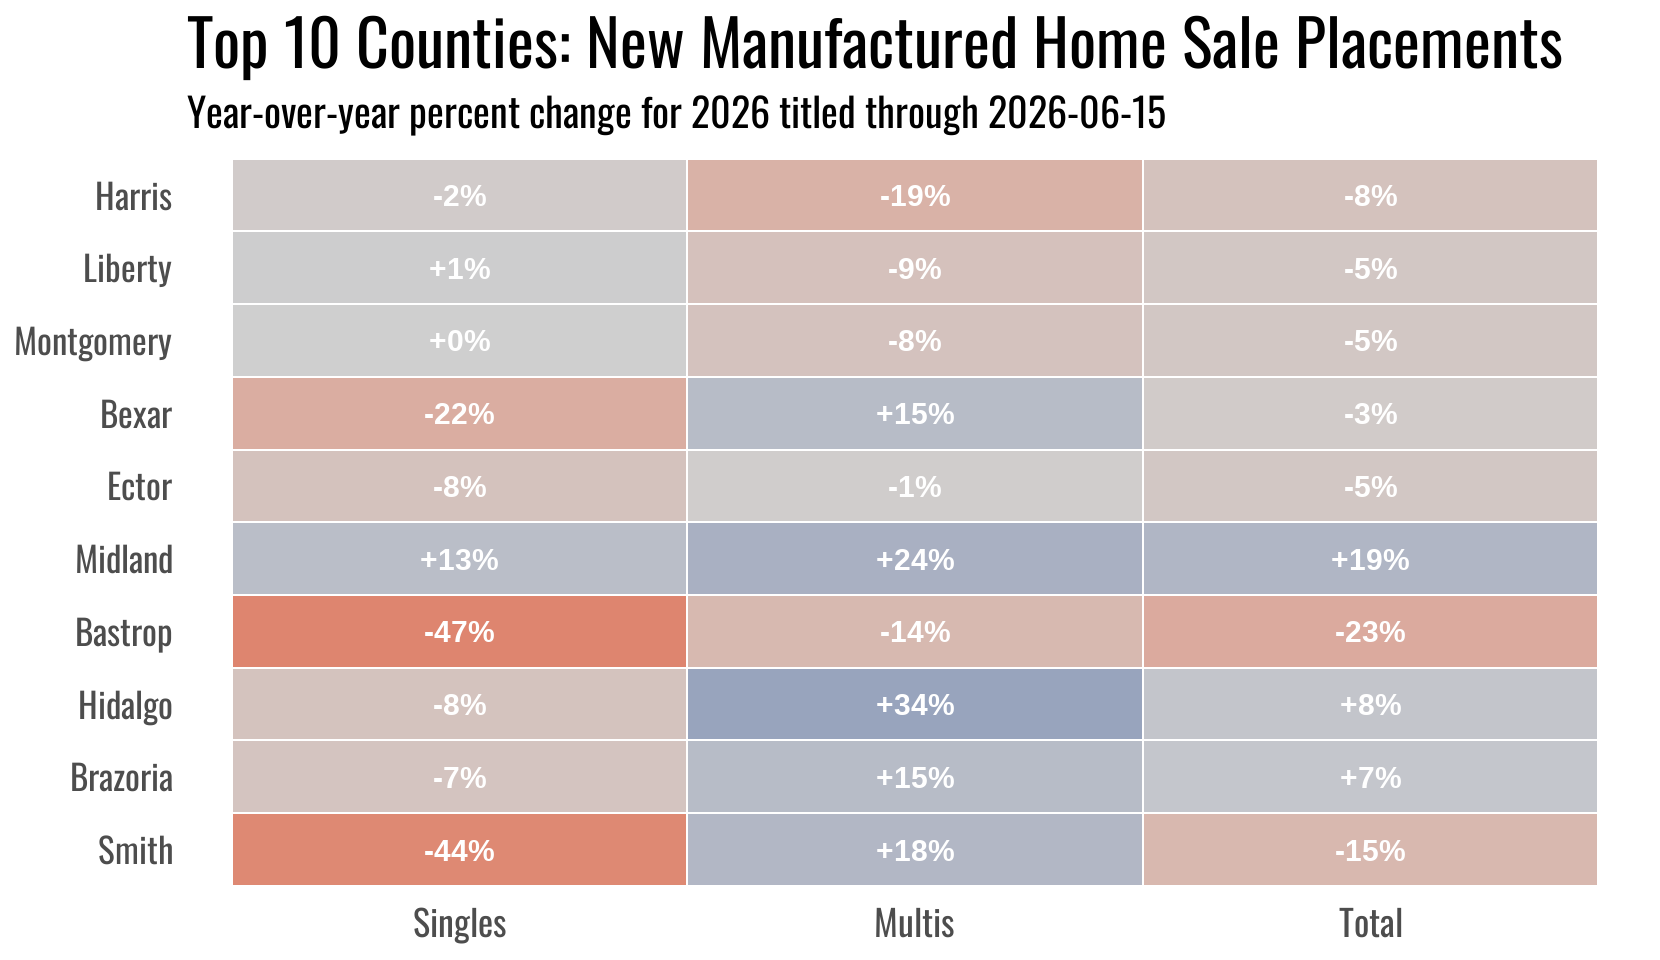
New Home Placement Locations
Here are the breakdowns in year-over-year changes for the top 10 counties in new home placements across home section types.
Midland at number six again leads the top 10 in year-over-year growth at +19.3%, with Hidalgo up 7.8% and Brazoria up 6.7% the only other gainers. The remaining seven counties are running below last year’s pace, with Bastrop down 23.2% and Smith down 14.8% showing the steepest declines.
TMHA Member’s Total Annual Retail Sales per County Report
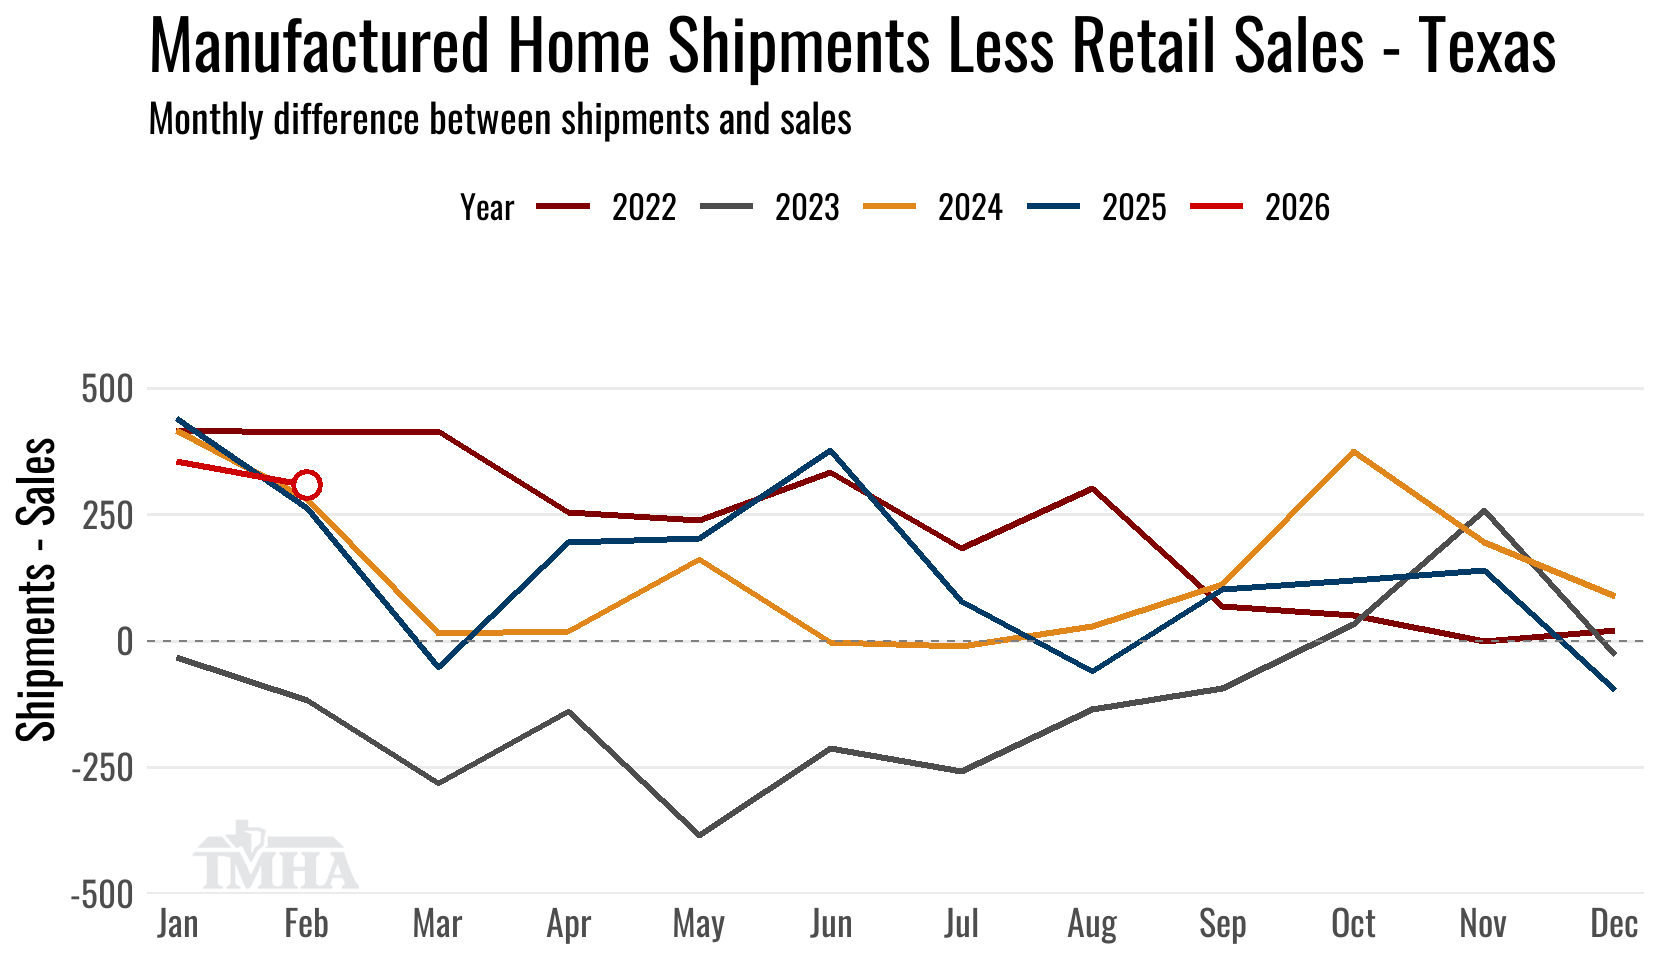
Shipment Comparison
So far the shipment less retail sales totals are tracking within the normal ranges for 2026.
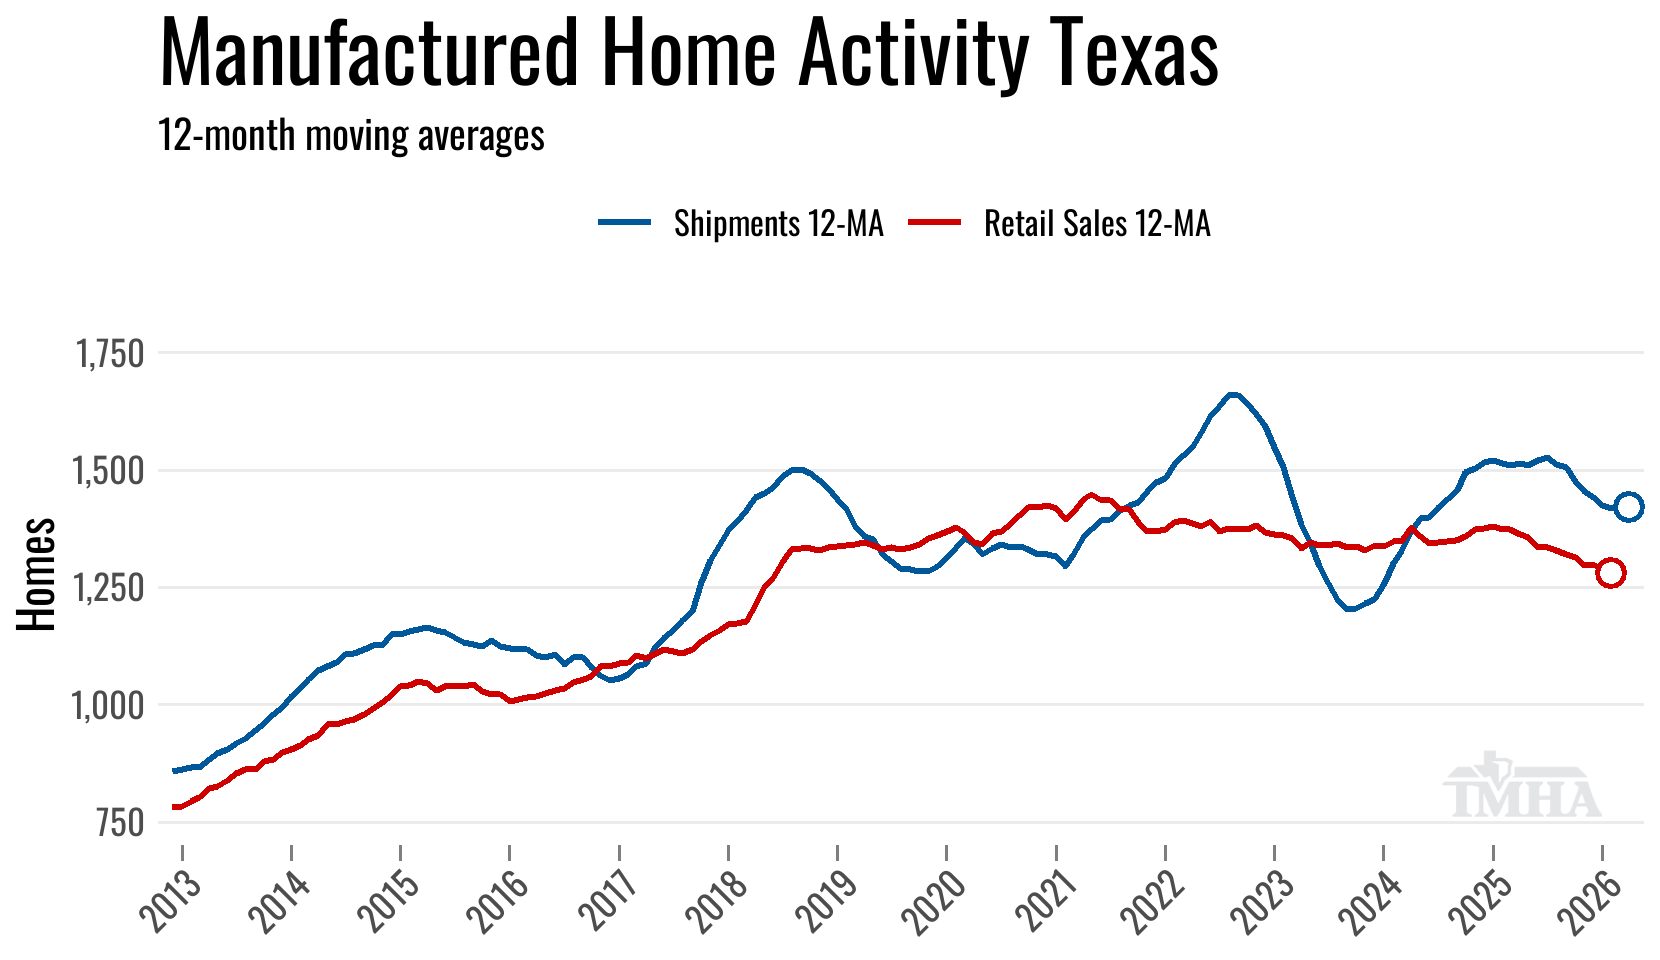
Moving Averages
The 12-month moving average for shipments peaked in July of 2025 for this last production expansion cycle and has drifted lower since, leveling off near 1,420 homes per month in the early months of 2026.
The 12-month moving average for retail sales is currently plotted through February 2026. Until that retail sales line starts moving up, shipments will continue to face headwinds.
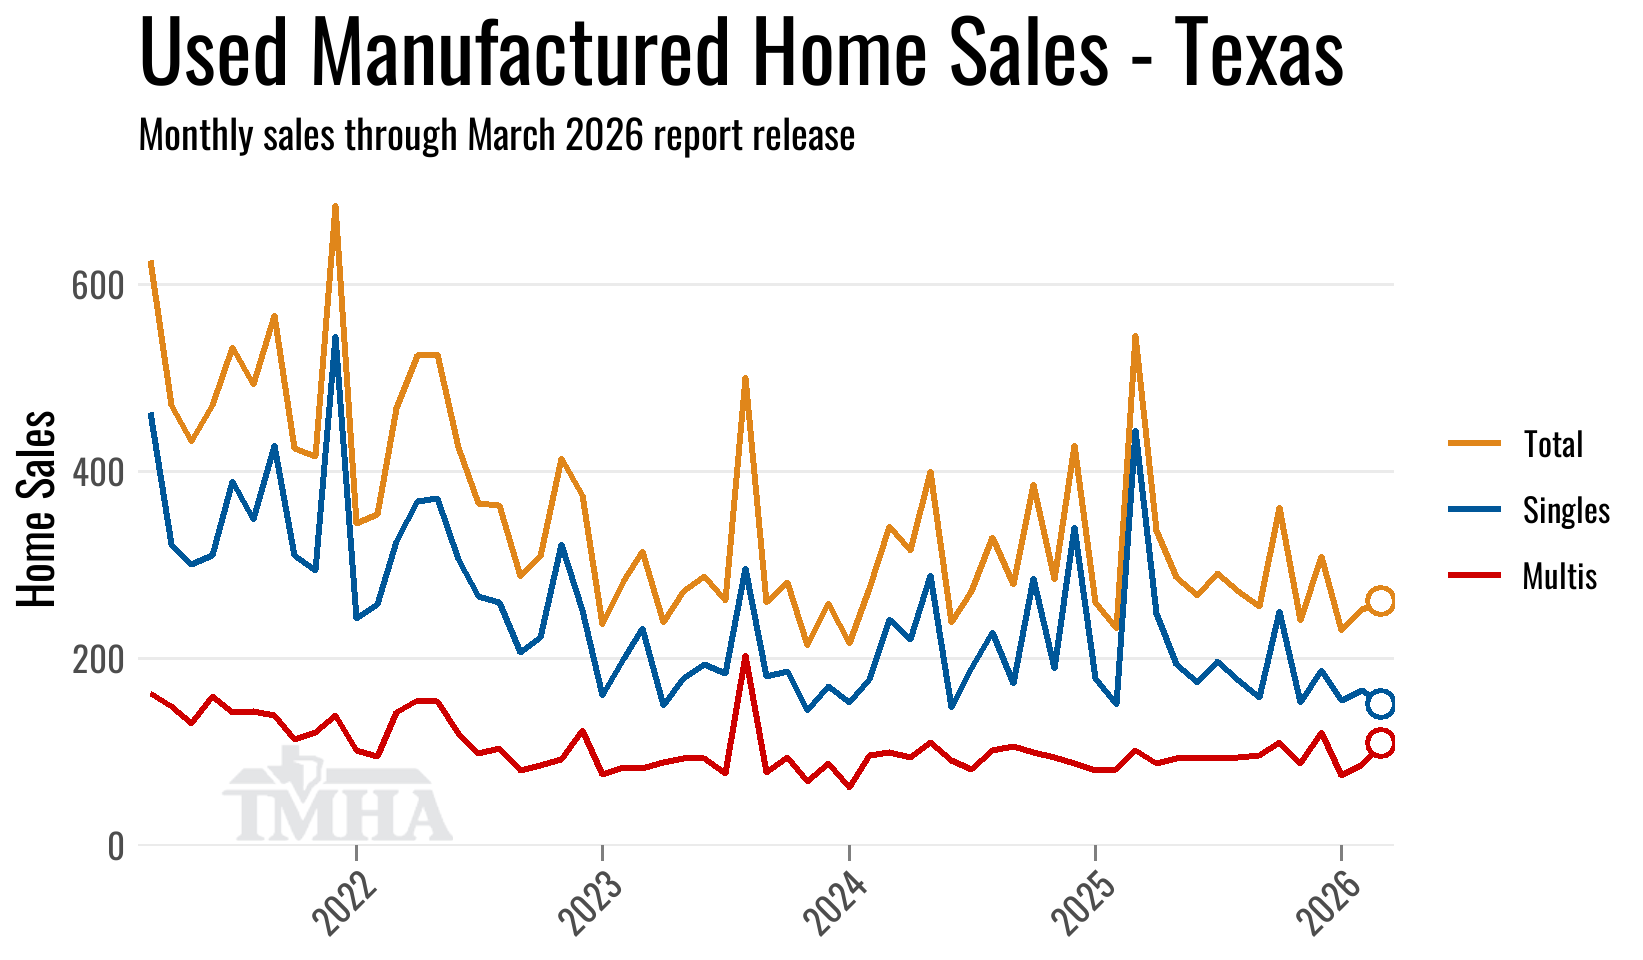
Used Homes
The used home retail sales data is noisy as it includes commercial purchases of park-owned homes after a manufactured home property is sold to a new buyer, but there was a clear downward trend in total transactions in the higher interest rate environment from 2022 through 2024 and have been roughly flat since.
| Used Sales | Singles | Multis | Total |
|---|---|---|---|
| Total for 2026 titled to date: | 674 | 394 | 1,068 |
| Change from 2025 (%): | 0% | 39.2% | 11.6% |
| Change from 2025 (Units): | 0 | 111 | 111 |
Revised Monthly Totals
Because titles continue to come in for past sales months, here are the prior 12 months and what their current sales totals are at this report release.
| New Sales Month | Singles | Multis | Total | (YoY%) |
|---|---|---|---|---|
| February 2026 | 415 | 665 | 1,080 | 1.1 |
| January 2026 | 386 | 570 | 956 | -2.8 |
| December 2025 | 519 | 752 | 1,271 | 12.1 |
| November 2025 | 416 | 707 | 1,123 | -9.9 |
| October 2025 | 506 | 814 | 1,320 | -4.8 |
| September 2025 | 519 | 759 | 1,278 | -1.8 |
| August 2025 | 533 | 935 | 1,468 | -0.1 |
| July 2025 | 545 | 777 | 1,322 | 2.3 |
| June 2025 | 505 | 637 | 1,142 | -14.8 |
| May 2025 | 590 | 788 | 1,378 | -3.0 |
| April 2025 | 609 | 866 | 1,475 | -6.6 |
| March 2025 | 630 | 920 | 1,550 | 2.9 |
| Used Sales Month | Singles | Multis | Total | (YoY%) |
|---|---|---|---|---|
| February 2026 | 166 | 87 | 253 | 26.5 |
| January 2026 | 155 | 75 | 230 | 1.3 |
| December 2025 | 188 | 121 | 309 | -18.9 |
| November 2025 | 153 | 88 | 241 | -3.2 |
| October 2025 | 251 | 111 | 362 | -0.5 |
| September 2025 | 159 | 97 | 256 | -3.4 |
| August 2025 | 177 | 95 | 272 | -12.8 |
| July 2025 | 197 | 94 | 291 | 14.6 |
| June 2025 | 175 | 93 | 268 | 20.2 |
| May 2025 | 194 | 93 | 287 | -13.3 |
| April 2025 | 249 | 88 | 337 | 14.6 |
| March 2025 | 444 | 102 | 546 | 67.5 |