Texas Manufactured Home Prices 2026 - Average Sales Price Analysis & Trends
Rob Ripperda
Manufactured Home Average Selling Prices - January 2026
Multi-section Homes
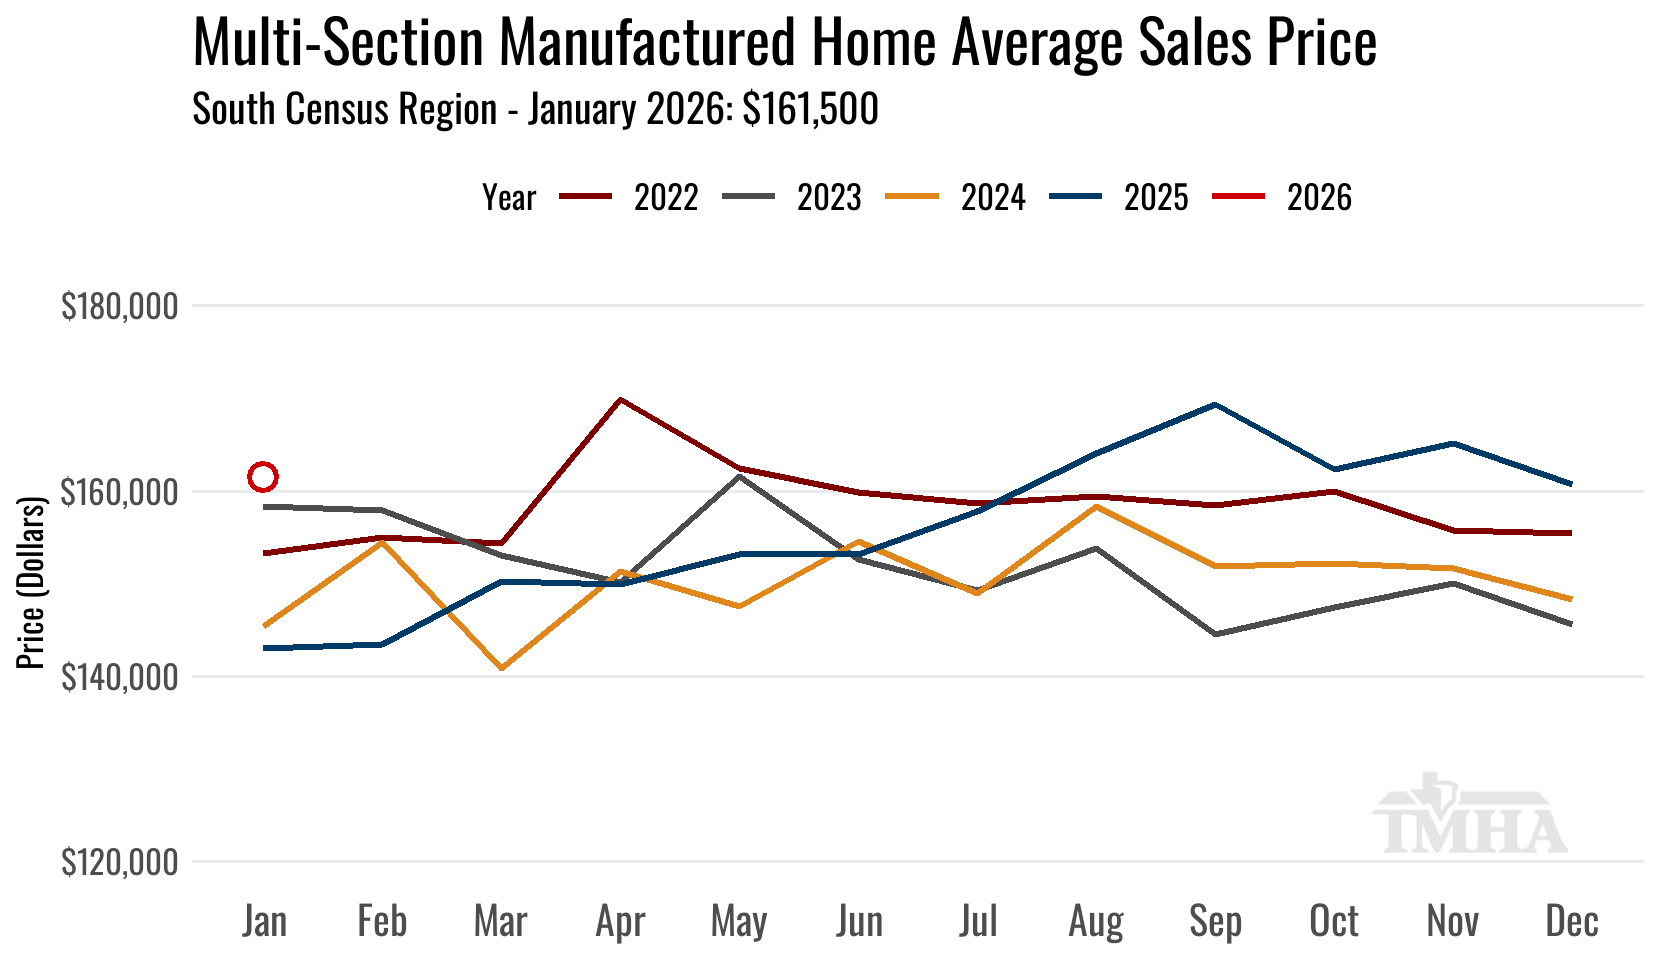
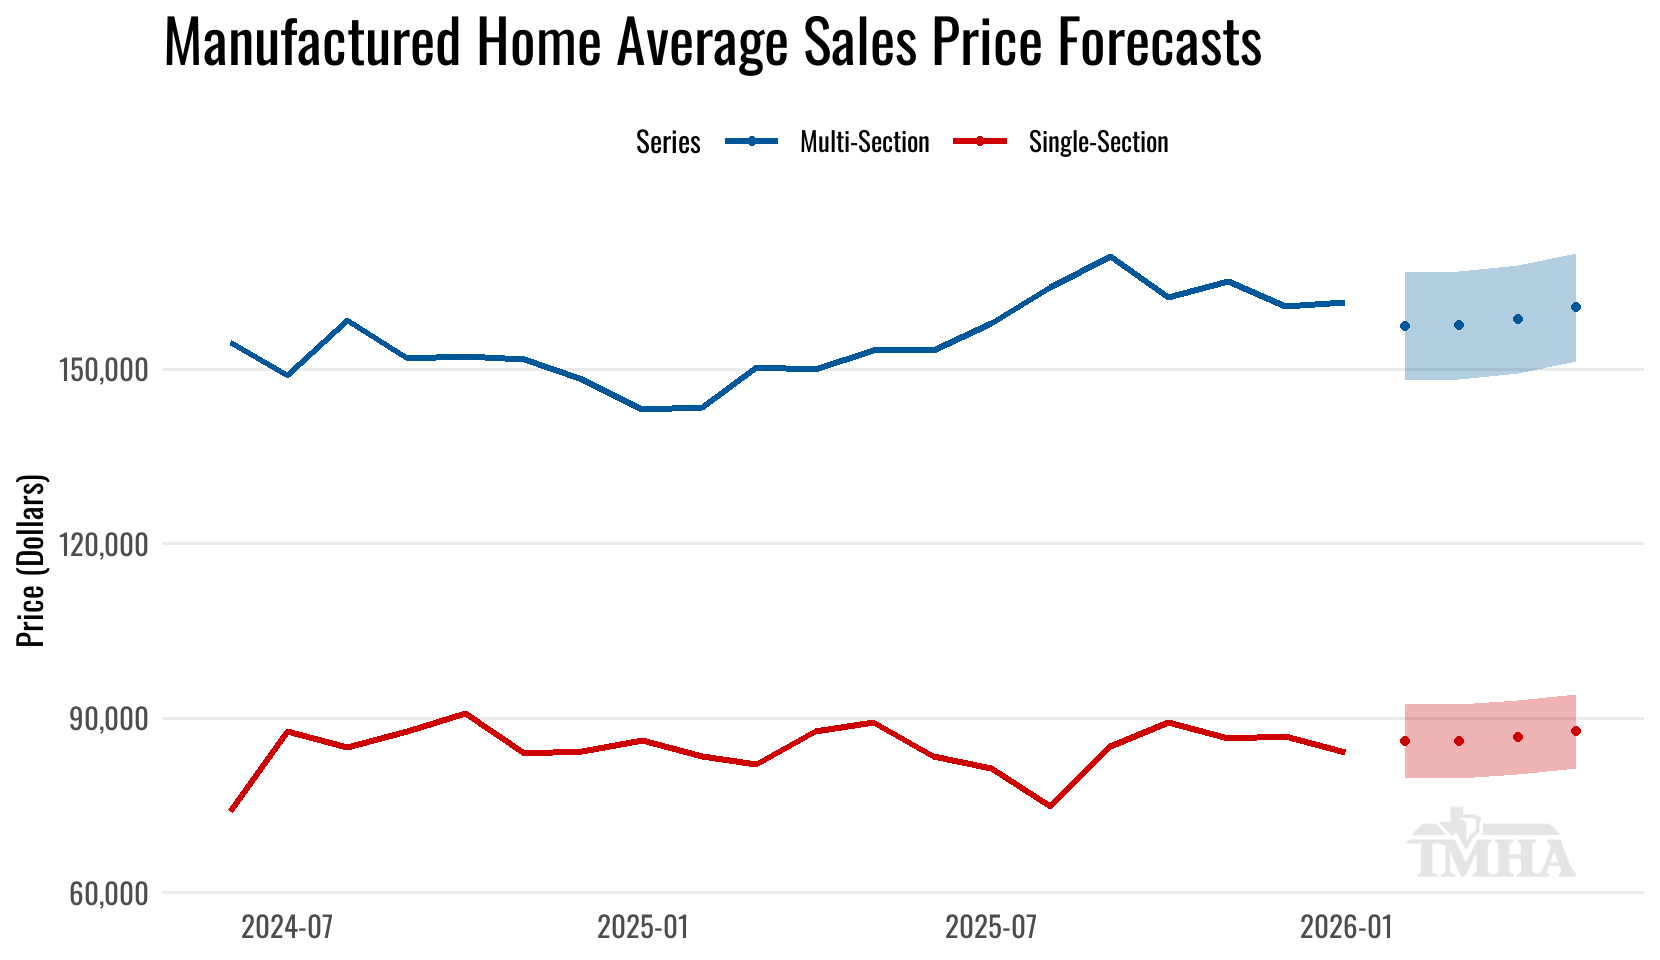
The average sales price for multi-section homes in the South Census Region was $161,500 in January 2026, up 0.5% from December. The January 2026 value was up 12.9% from January of 2025 nominally and up 10.3% after adjusting for inflation.*
Nominal average prices for multi-section homes opened 2026 at $161,500, roughly level with December and holding most of the step-up that began in mid-2025, though still below the September peak of $169,400. Inflation-adjusted prices remain below 2022 levels and below the January 2023 real average price.
This chart is built off of the US Census Bureau’s Manufactured Housing Survey (MHS) Tables
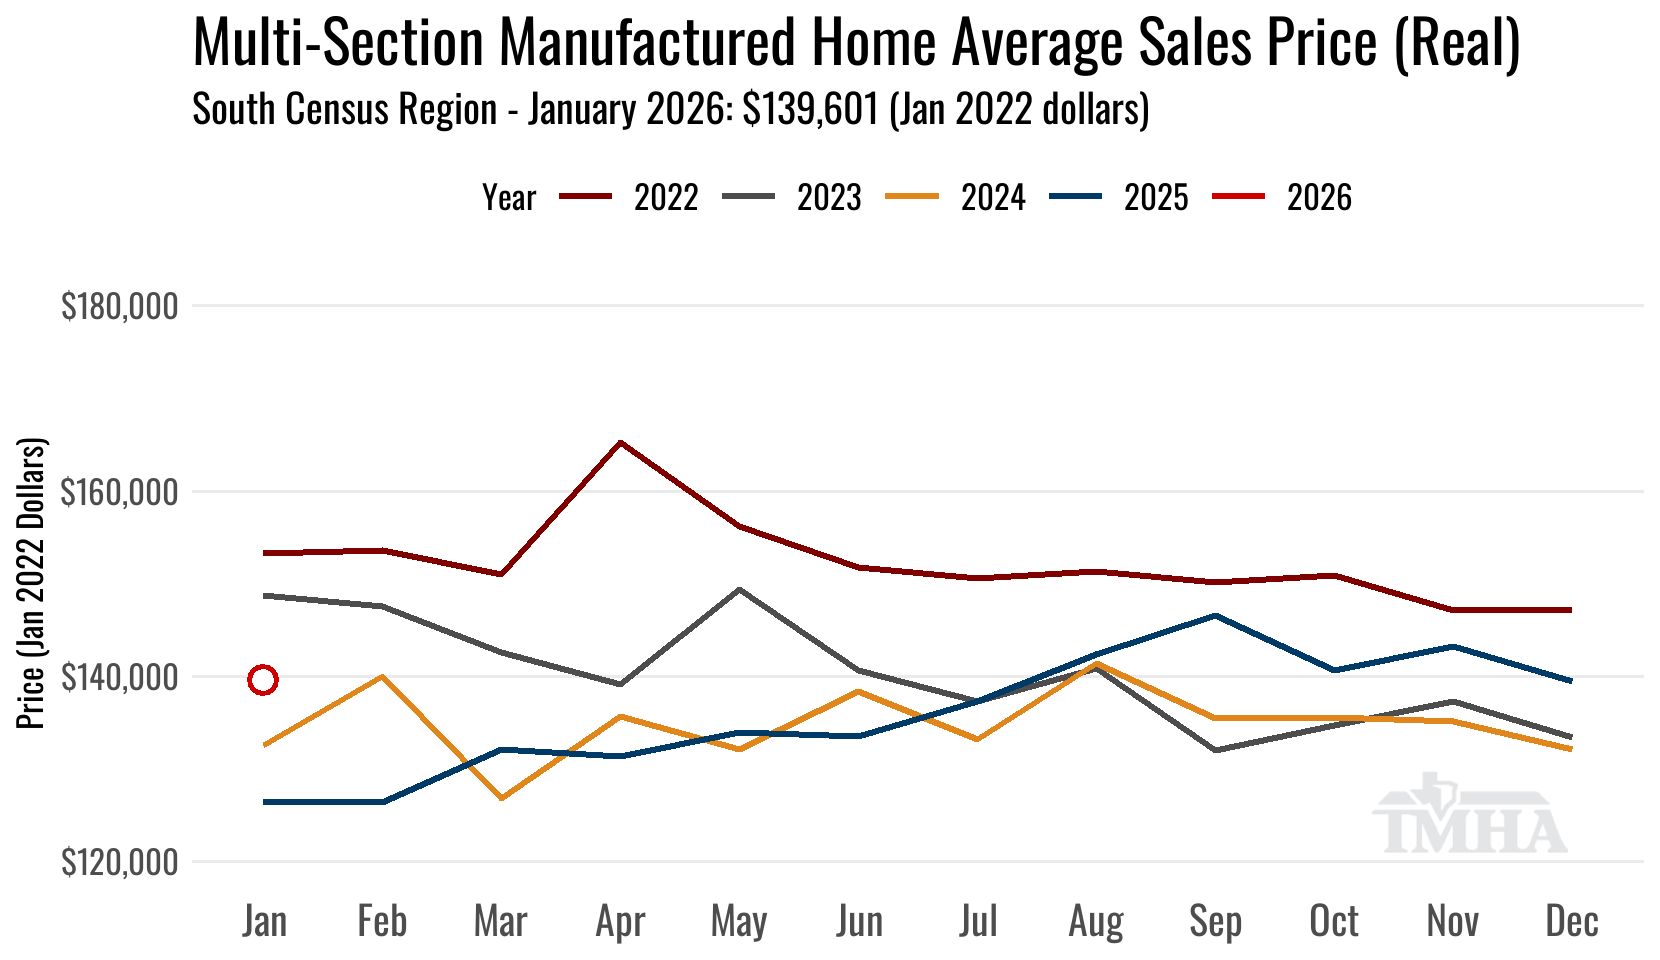
This chart is built off of the US Census Bureau’s Manufactured Housing Survey (MHS) Tables. Price values have been inflation adjusted to January 2022 dollars. The October CPI-U value was not published due to a government appropriations lapse and has been linearly interpolated from the September and November values.
Single-section Homes
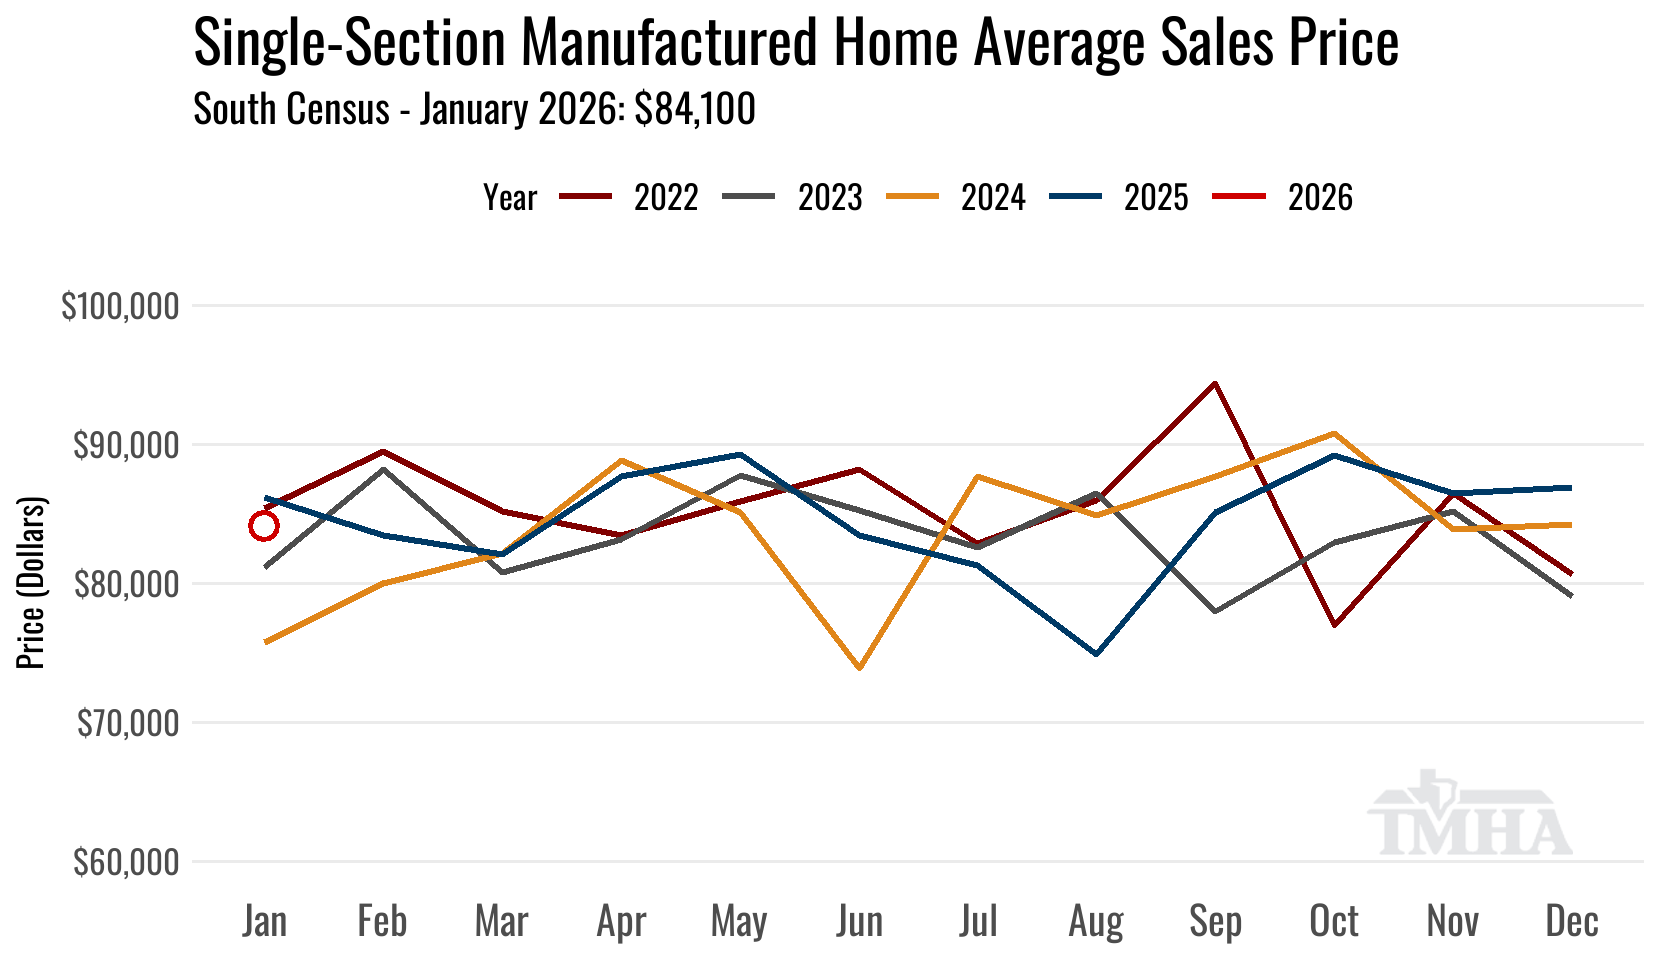
The average sales price for single-section homes in the South Census Region was $84,100 in January 2026, down 3.2% from December. The January 2026 value was down 2.4% from January of 2025 nominally and down 4.7% after adjusting for inflation.*
For single-section homes nominal prices have held in a relatively narrow range over the last four years. Inflation-adjusted, January 2026 opened below every January since 2022 save for 2024.
This chart is built off of the US Census Bureau’s Manufactured Housing Survey (MHS) Tables
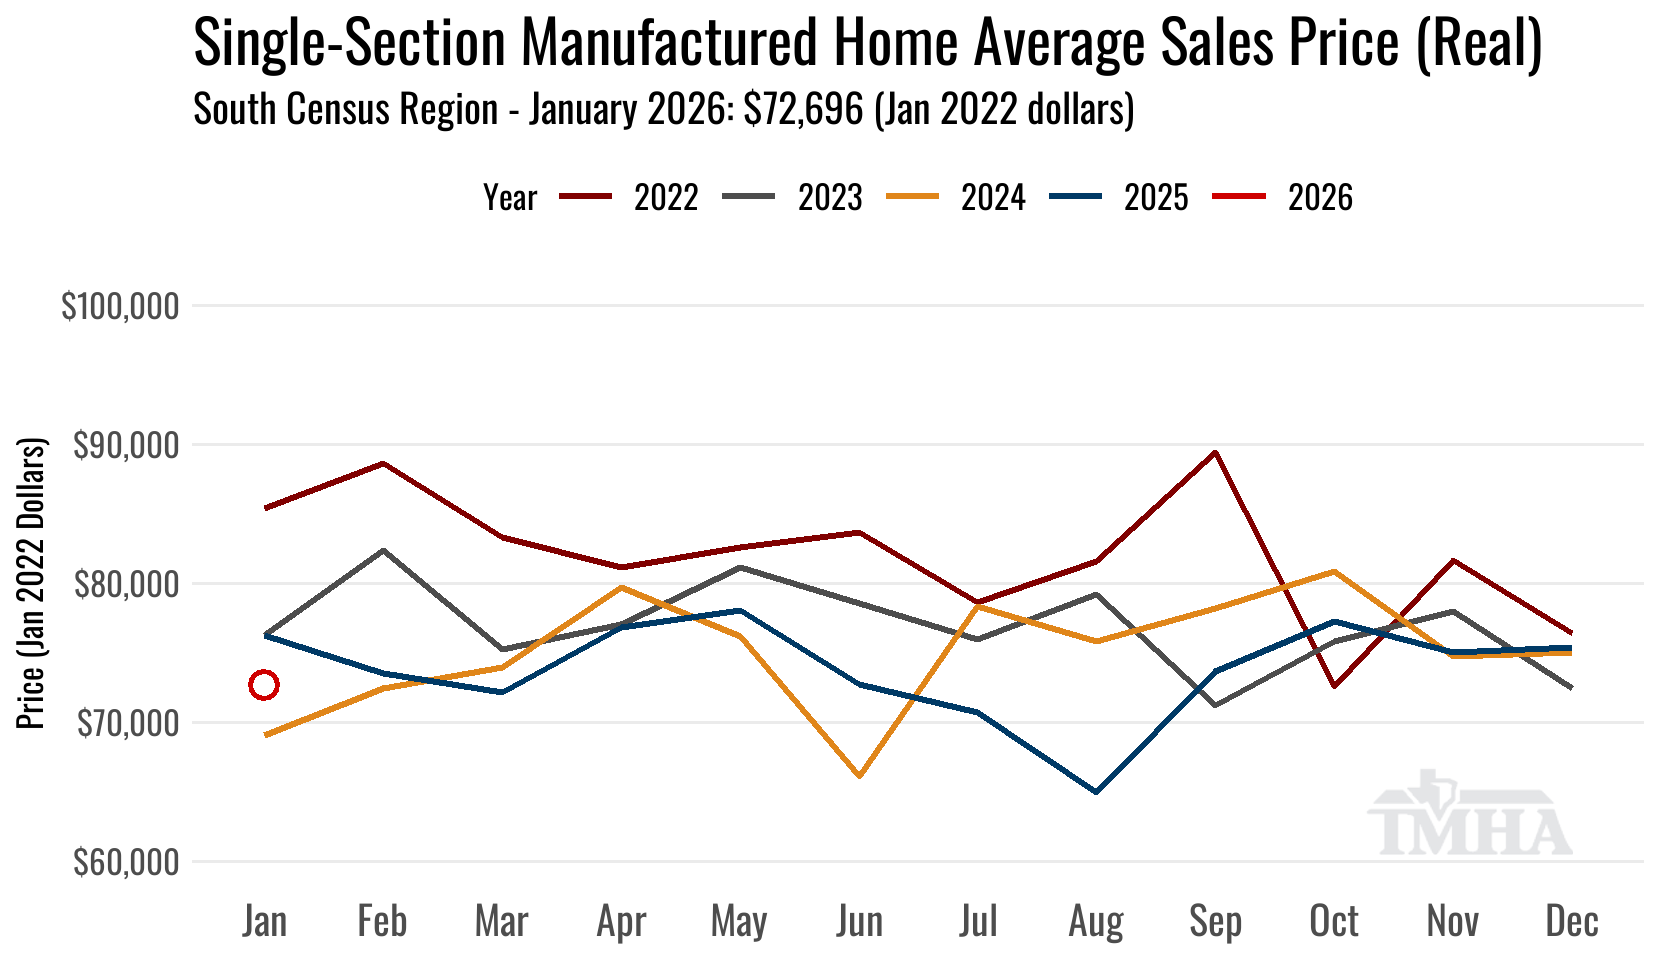
This chart is built off of the US Census Bureau’s Manufactured Housing Survey (MHS) Tables. Price values have been inflation adjusted to January 2022 dollars. The October CPI-U value was not published due to a government appropriations lapse and has been linearly interpolated from the September and November values.
Average Retail Selling Prices with TMHA Forecasts
Using a regression model based on the most recent May 2026 Producer Price Index for manufactured housing data, the forecasted average multi-section sales price is estimated at $160,600 (+/- $9,300) for multi-sections and $87,800 (+/- $6,300) for single-section homes*.
Find out more from a retailer near you
The PPI is not a perfect predictor for the Census’ Manufactured Housing Survey average price results, but it does account for over 90% of the variability when used in a regression model as the explanatory variable.