Texas Manufactured Housing Market Report May 2026 - Sales Data & Analysis
Rob Ripperda
May
Early Look
New manufactured home sales for May 2026 titled to date are so far up a seasonally-adjusted 15.3% from the previous month and are running 23.8% above May of 2025 as the titling shift that has been underway since August of 2025 continues to inflate early reporting year-over-year comparisons.
Until we get through the summer of 2026, year-over-year numbers should remain high, especially for the early look.
As you can see in the plot below the early May sales counts are running above the previous years due to the titling cadence change, while the first four months of the year are trailing 2025.
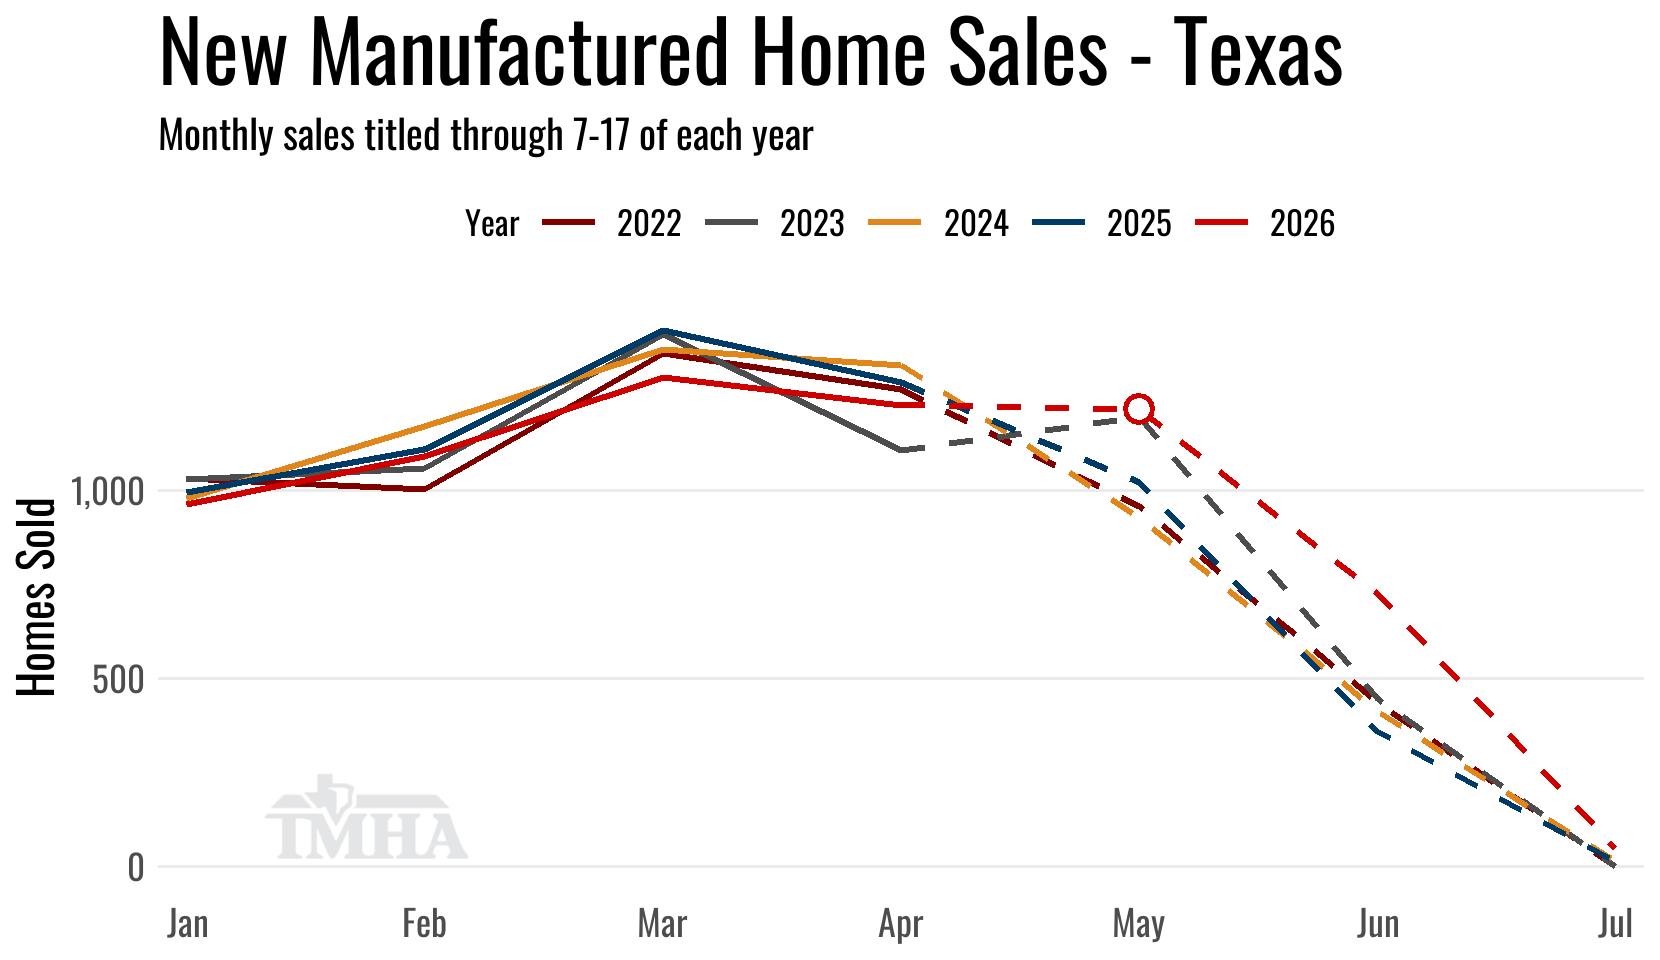
Solid lines represent months for which the on-time titling window has closed. Dashed lines are preliminary months for which titles are still being counted toward the reported total.
The comparisons in the table below are based on where the previous month’s numbers were when originally reported on one month ago.
| New Sales | Singles | Multis | Total |
|---|---|---|---|
| Total for May: | 430 | 787 | 1,217 |
| Change from April (Raw %): | 14.1% | 8.6% | 10.4% |
| Change from April (Raw Units): | 53 | 62 | 115 |
| Change from April (SA %): | 21.6% | 15.6% | 15.3% |
| Change from May of 2025 (%): | 3.4% | 38.8% | 23.8% |
| Change from May of 2025 (Units): | 14 | 220 | 234 |
TMHA Member’s Retailer Annual Sales Totals Report
April
Titled on Time
New home sales for April titled to date were up a seasonally adjusted 1.9% from the previous month but are down 3.5% on the raw total from April of 2025.
The 1,226 total homes sold was the second report release in a row that was down year-over-year despite the titling shift working in its favor, but the seasonally-adjusted improvement in the May early look above is evidence that sales picked up after a slower March and April.
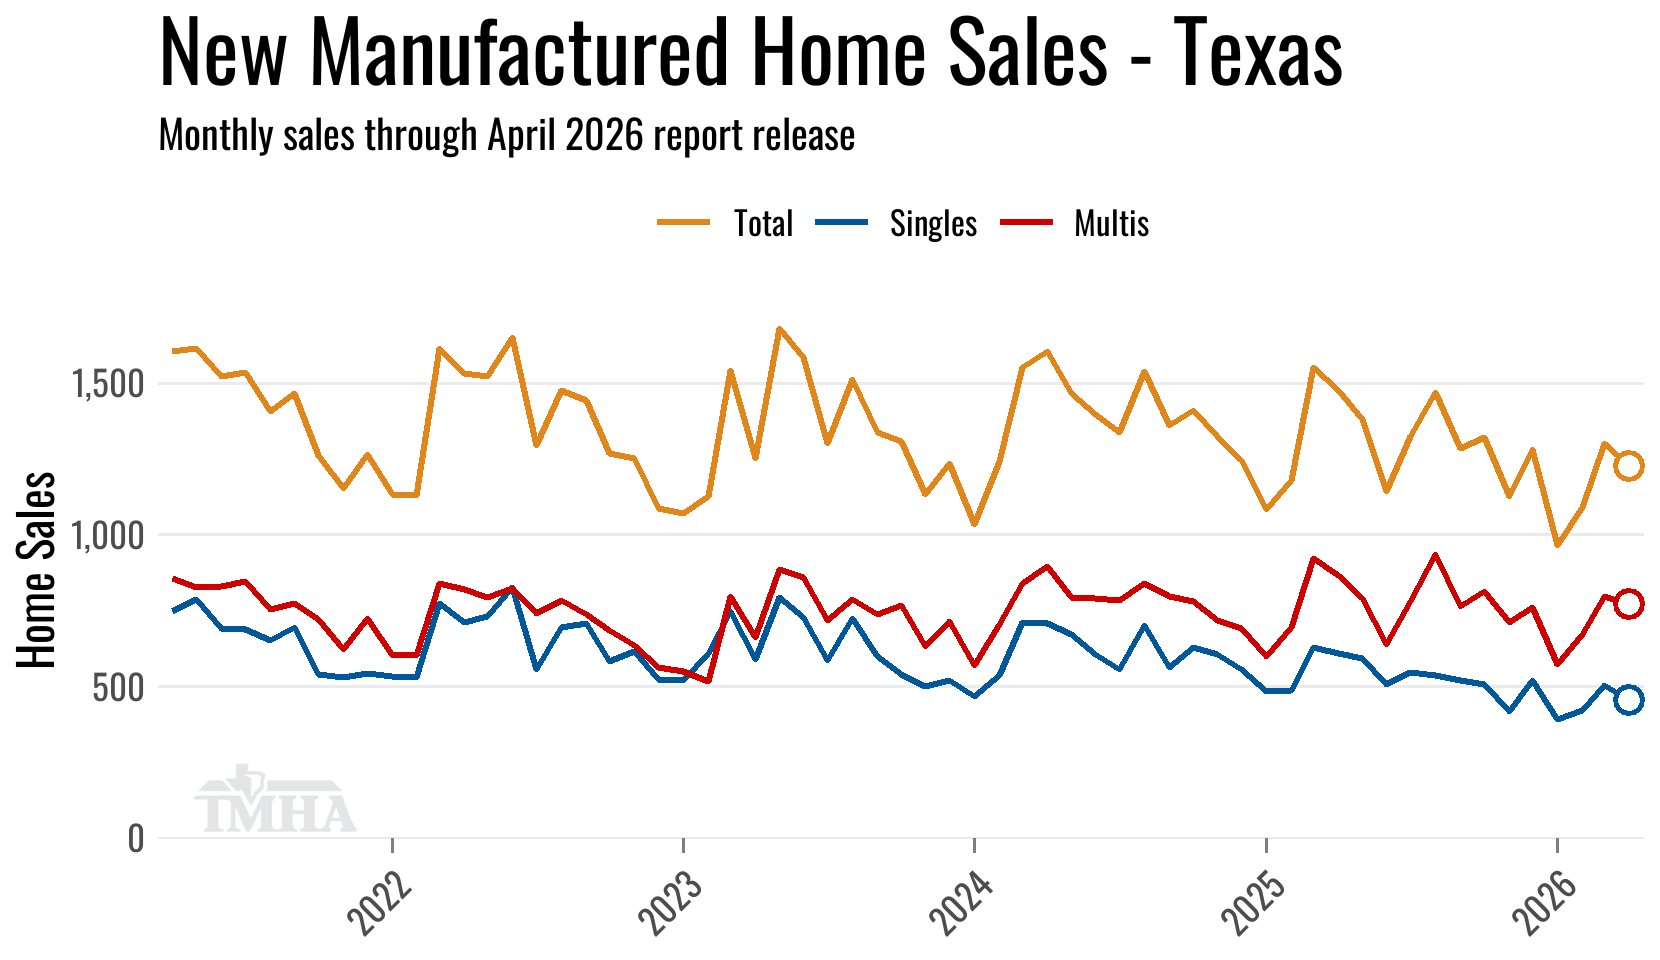
While the plot above contains revised totals for previous months the comparisons in the table below are based on where the previous month’s numbers were when released one month ago.
| New Sales | Singles | Multis | Total |
|---|---|---|---|
| Total for April: | 455 | 771 | 1,226 |
| Change from March (Raw %): | -7% | -0.6% | -3.1% |
| Change from March (Raw Units): | -34 | -5 | -39 |
| Change from March (SA %): | -0.9% | 0.5% | 1.9% |
| Change from April of 2025 (%): | -11.3% | 1.7% | -3.5% |
| Change from April of 2025 (Units): | -58 | 13 | -45 |
TMHA Member’s Retailer Monthly Sales Totals Report
Installation Location Trends
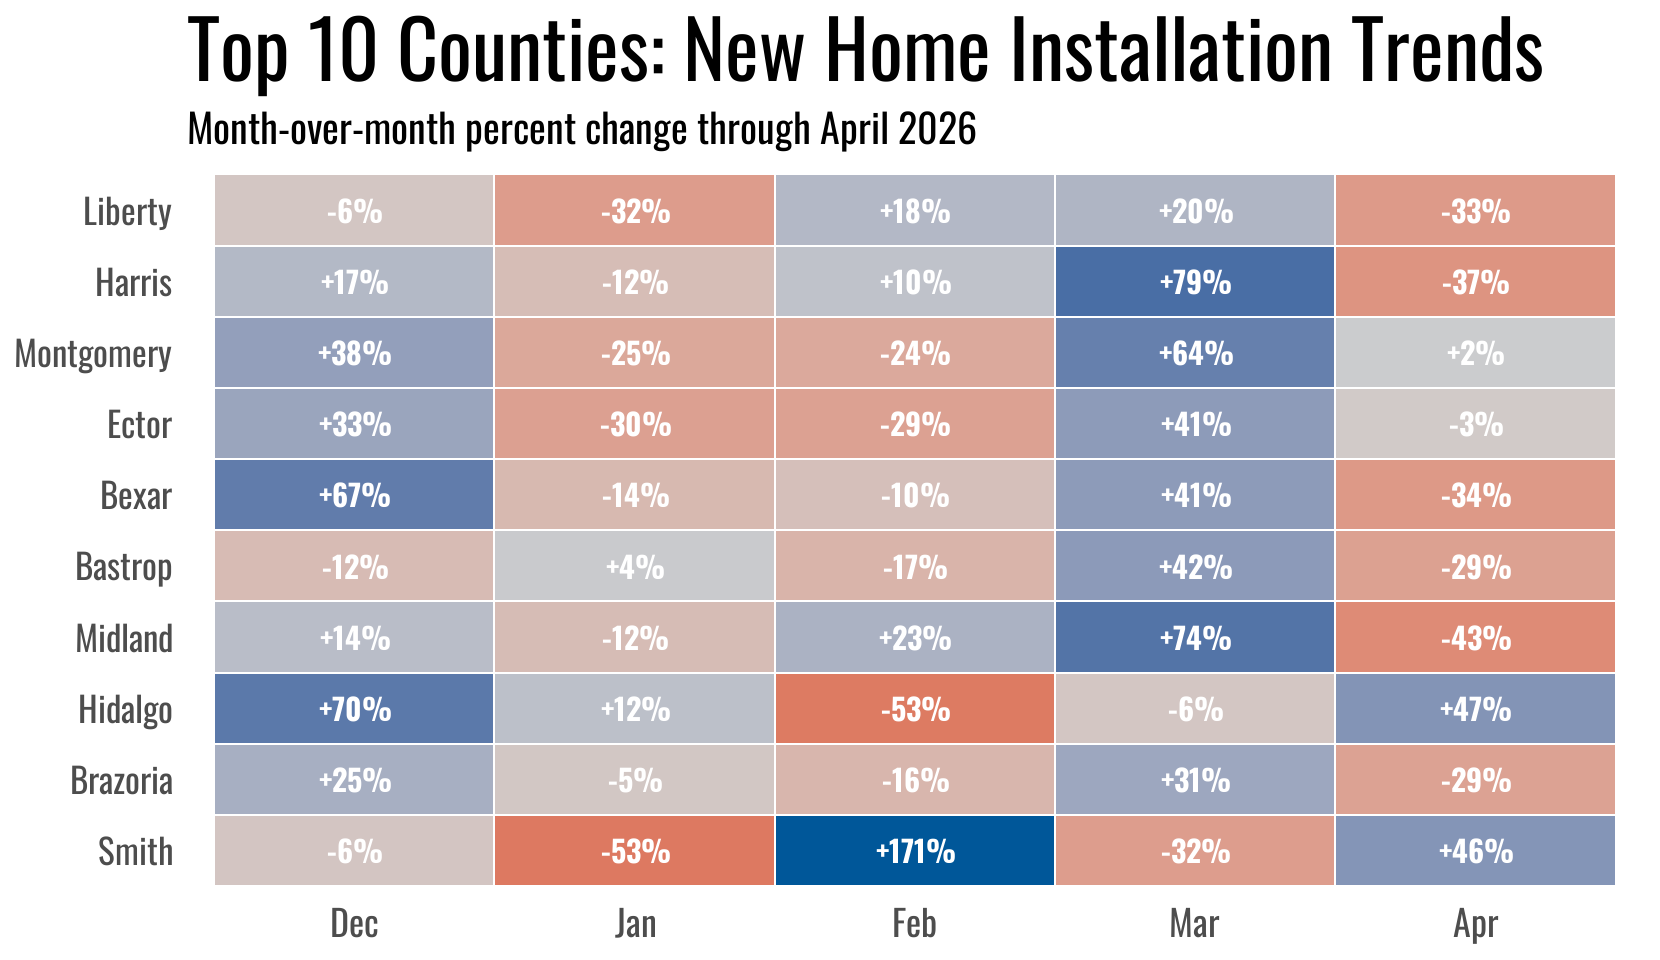
Here are the month-over-month changes for the top 10 counties for new home sales over the past six months, ranked by their total placements across that span.
April gave back March’s surge. Seven of the top ten declined, with Midland down 43%, Harris 37%, Bexar 34% and Liberty 33% the steepest — unwinding a March in which most of those same counties had jumped 40% to 80%. Montgomery and Ector were essentially unchanged, within three percent of March. Hidalgo and Smith were the only real gainers, up 47% and 46%.
TMHA Member’s Retailer Annual Sales Total per County Report
Annual Totals
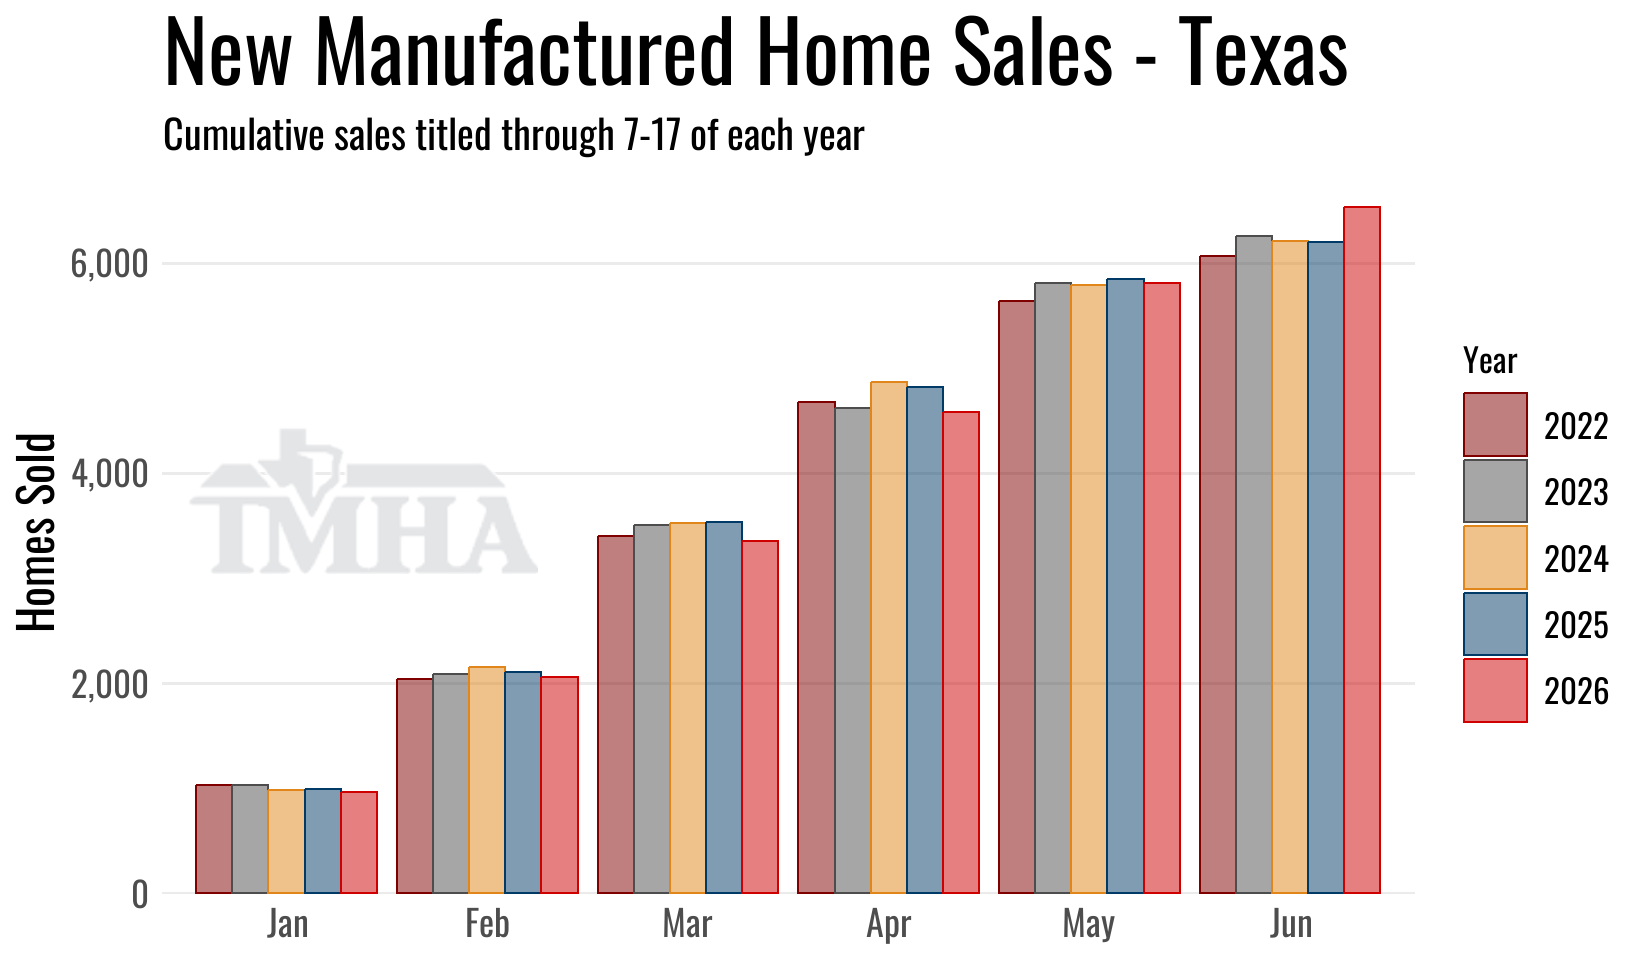
New home sales in 2026 are showing a 5.8% gain year-over-year for titles processed through this point compared to 2025.
Multi-section sales are up 12.3% year-over-year while single-section sales are down 3.3%.
As noted above, the titling phase shift should be inflating 2026 year-over-year comparisons somewhat through this first half of 2026, but some of that is simply pushing sales into June that a year ago would have been tallied as revisions to earlier months. The effect shouldn’t be as pronounced at the cumulative annual total as it is at the comparative month level.
| New Sales | Singles | Multis | Total |
|---|---|---|---|
| Total for 2026 titled to date: | 2,487 | 4,090 | 6,577 |
| Change from 2025 (%): | -3.3% | 12.3% | 5.8% |
| Change from 2025 (Units): | -85 | 447 | 362 |
TMHA Member’s Retailer Annual Sales Totals Report
New Home Characteristics
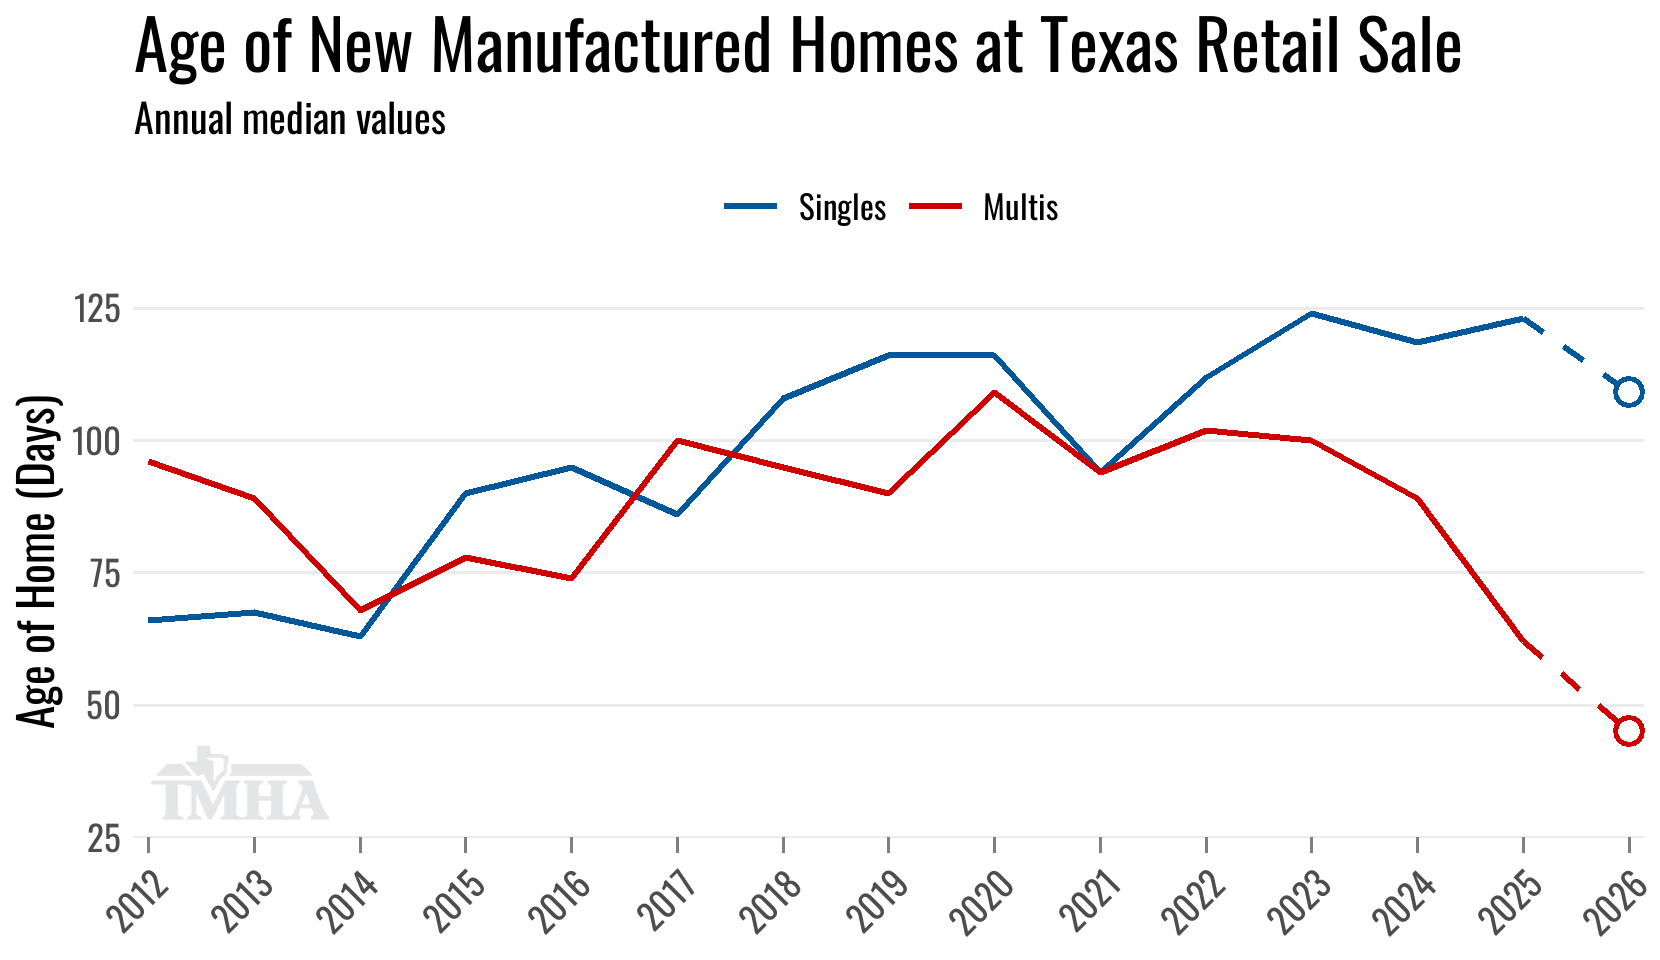
The shift in title cadence has really pulled down the median age of multi-section homes to the shortest amount of days in our records, and the same dynamic had not been showing with single-section homes until this last month of titling data pulled their median down for the first time in years. Given how much the median has moved for multi-section homes, we suspect the change in date of sale guidance had an outsized effect on those home sale transactions, but the single-section market has also underperformed the multi-section market for several years now, so it makes sense they are taking longer to turn.
| New Home Characteristics for 2026 | Singles | Multis | Total |
|---|---|---|---|
| Median Age of Home (Days): | 109 | 45 | 63 |
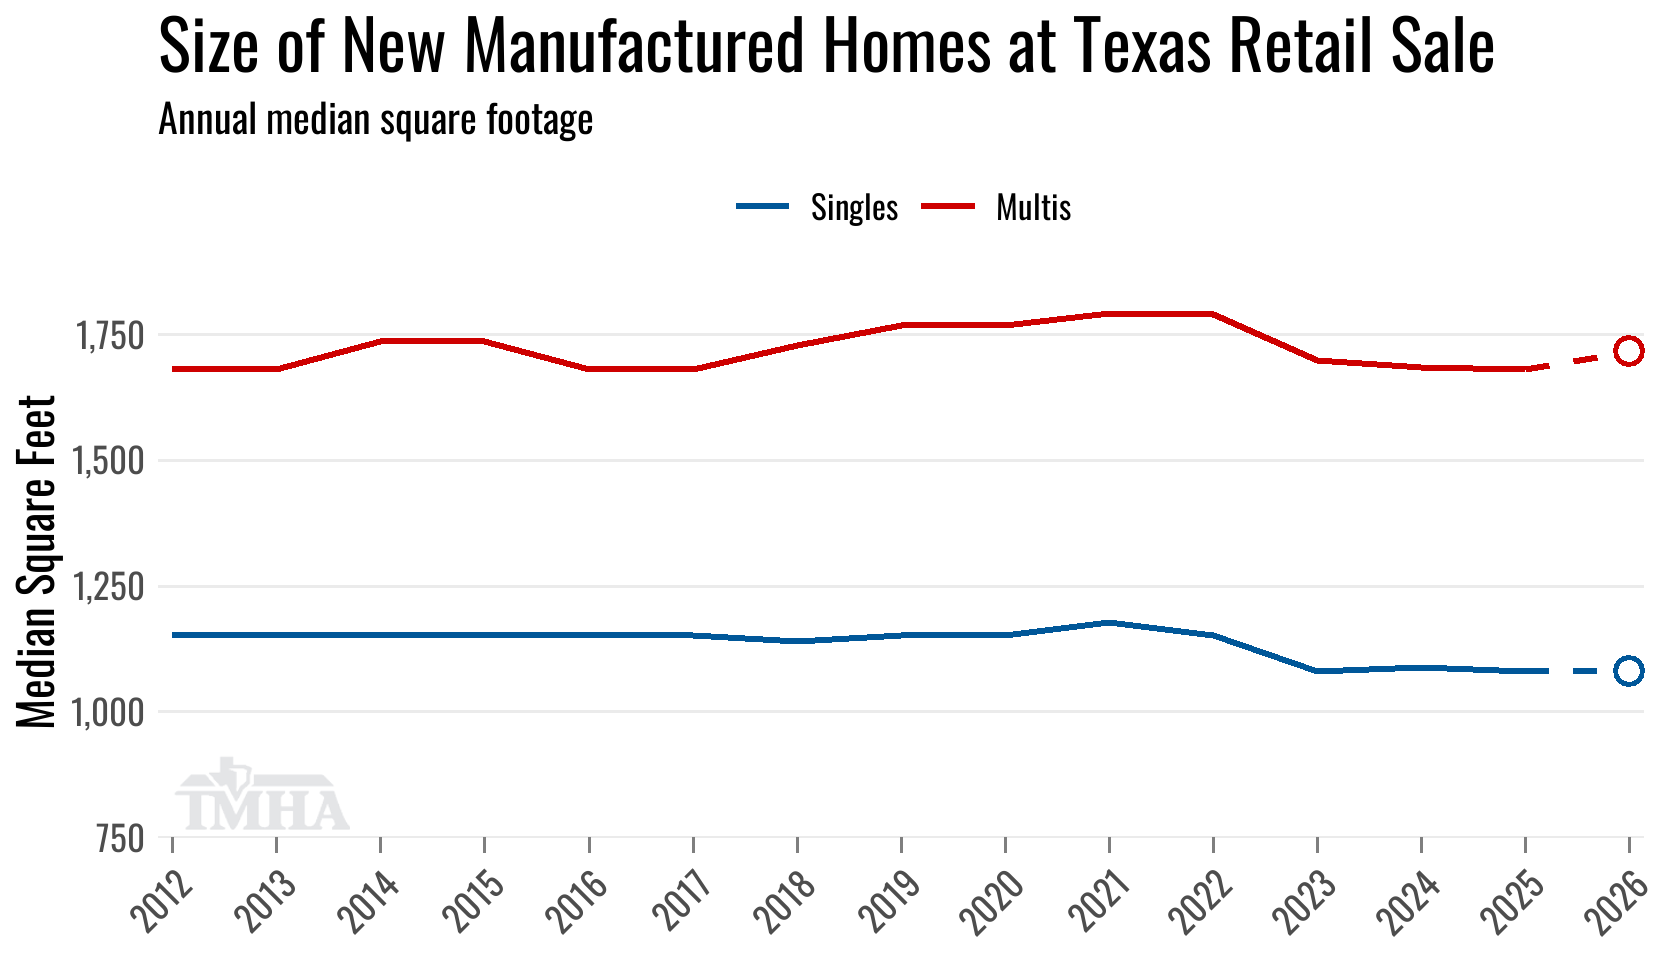
| Median Square Footage: | 1,080 | 1,717 | 1,475 |
Beyond the age of homes at purchase, the square footage plot below shows a structural shift in Texans downsizing new home purchases when the affordability squeeze set in. The break is sharp and lands in a single year: both section types held their long-run size through 2022 and stepped down together in 2023. Multi-section medians moved from roughly 1,790 square feet to about 1,700, and single-section homes from roughly 1,150 to 1,080, where both have held since. Multis are running 1,717 so far this year, a modest uptick, though 2026 is a partial year and still settling.
New Home Placement Locations
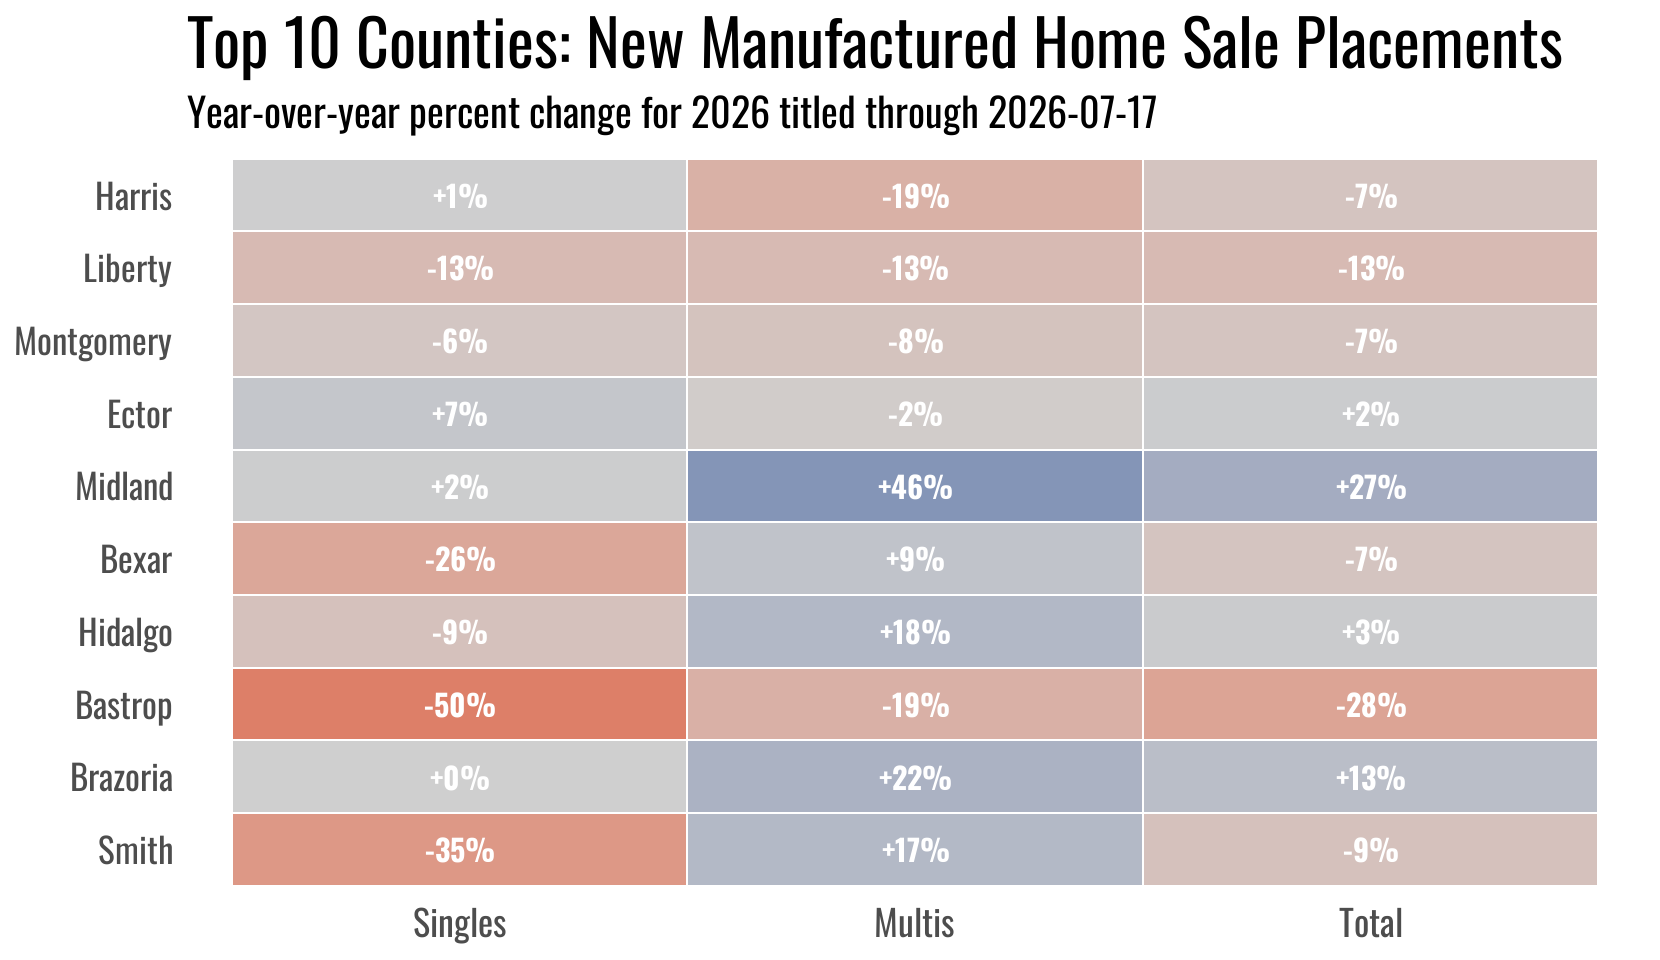
Here are the breakdowns in year-over-year changes for the top 10 counties in new home placements across home section types.
Midland, now fifth in volume, leads the top 10 in year-over-year growth at +27.0%, well clear of Brazoria at +13.4%; Hidalgo (+2.9%) and Ector (+2.2%) are the only other counties running ahead of last year’s pace through July 17. The remaining six are behind, with Bastrop down 27.6% and Liberty down 13.2% showing the steepest declines.
TMHA Member’s Total Annual Retail Sales per County Report
Shipment Comparison
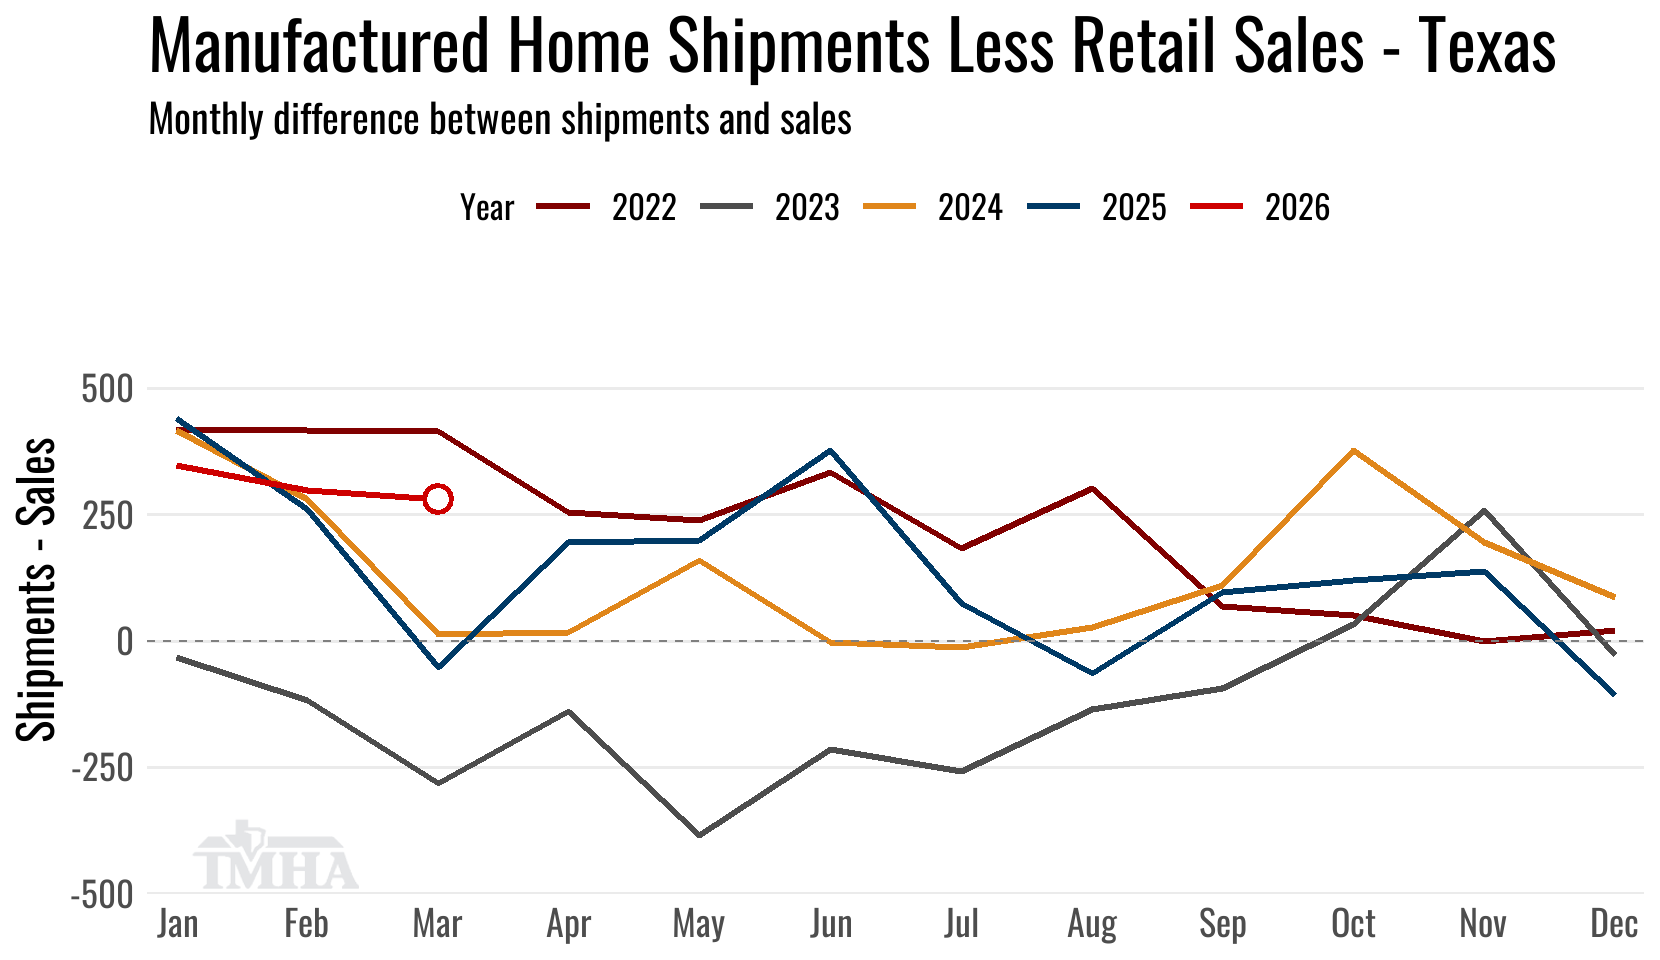
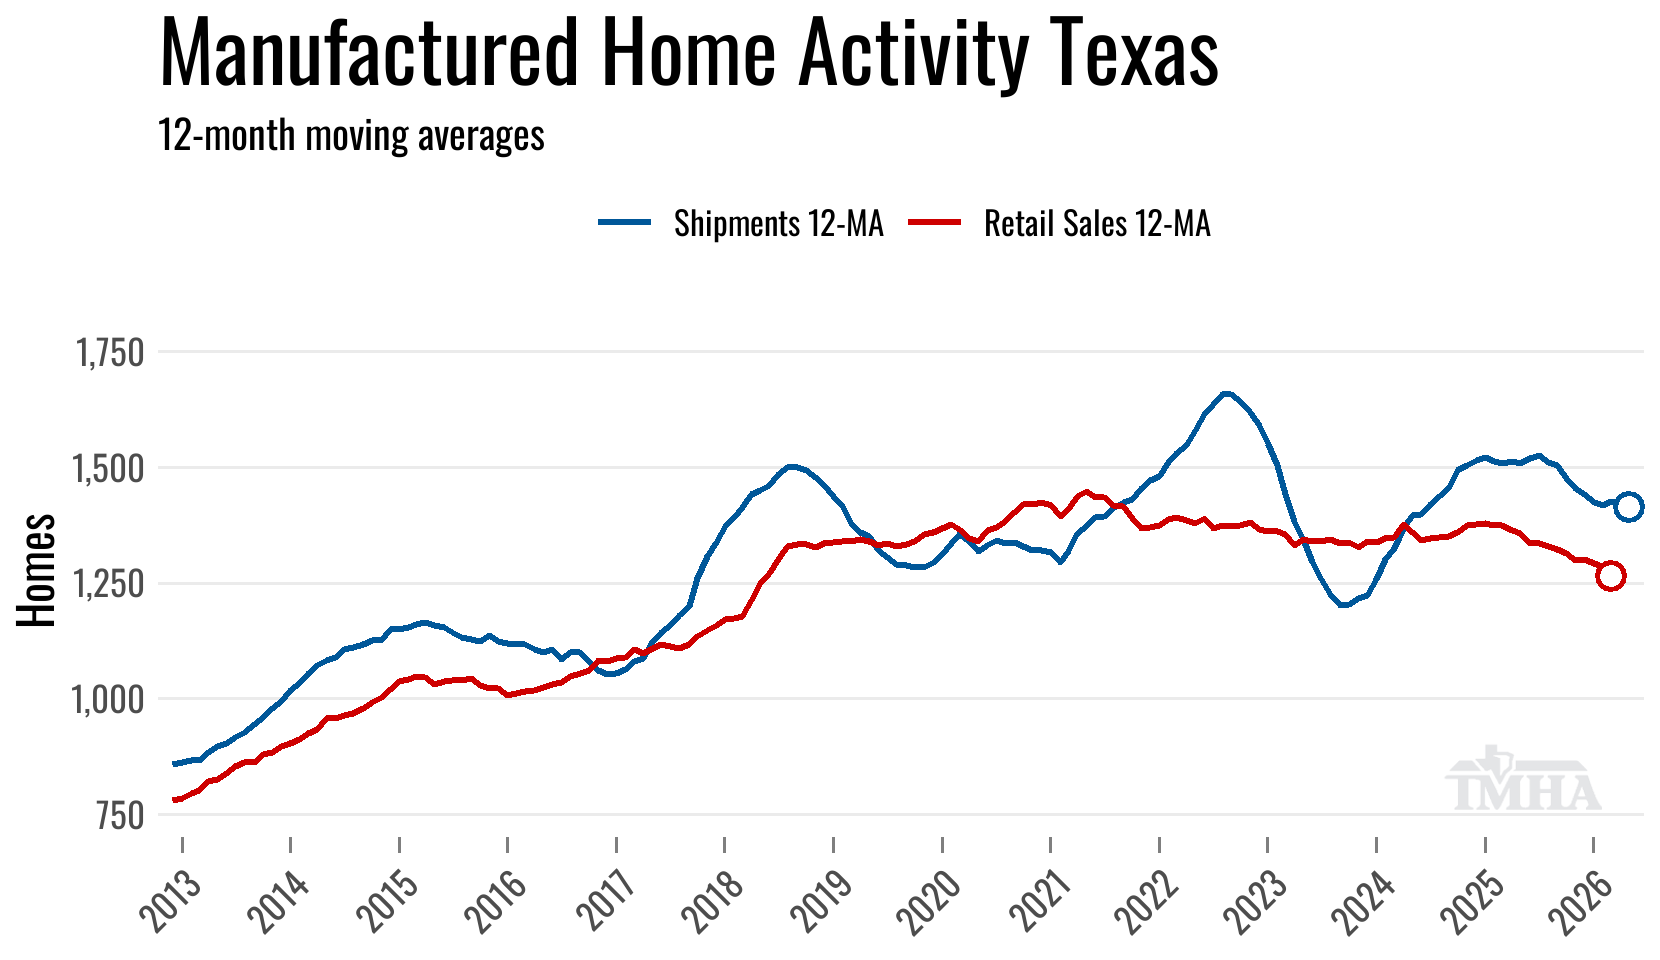
The slowdown in titles issued with March sales dates have now pulled the shipment less retail sales total to an elevated position. Still below the March peak in 2022, but above the previous three years. The title date changes are certainly pushing this metric up to some extent as titles that would have been stamped with a purchase agreement date in March in previous years are now being titled with a later transfer of ownership date.
Moving Averages
The 12-month moving average for shipments peaked in July of 2025 for this last production expansion cycle and has drifted lower since with the exception of one upturn in March 2026.
The 12-month moving average for retail sales is currently plotted through March 2026. Until that retail sales line starts moving up, shipments will continue to face headwinds.
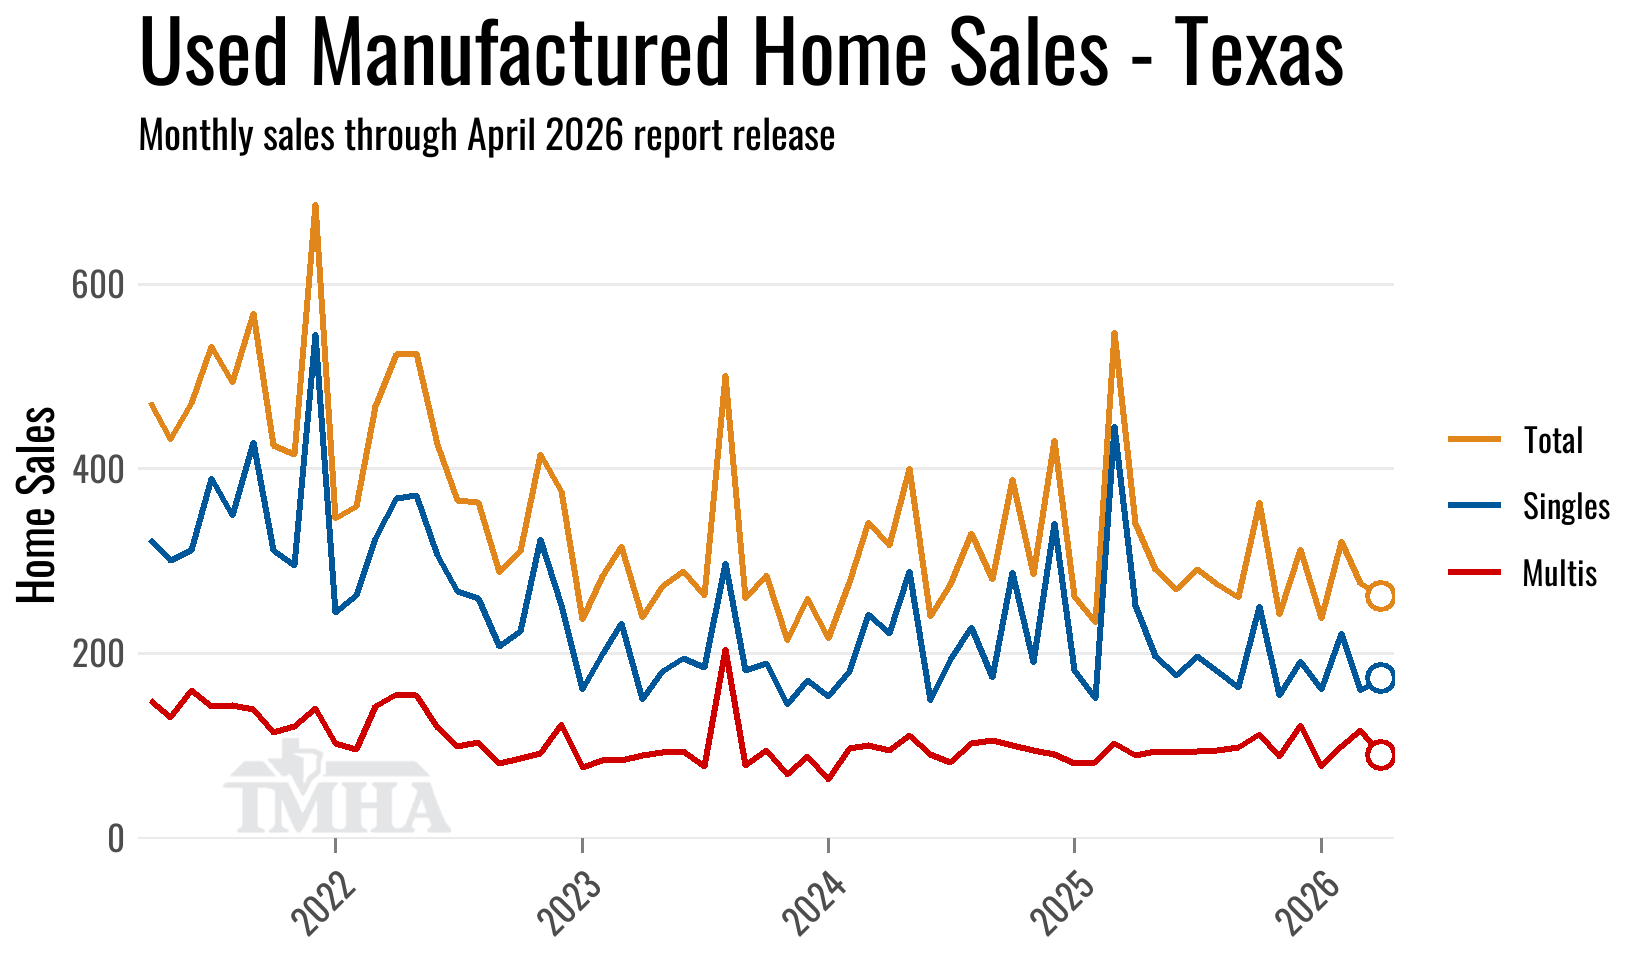
Used Homes
The used home retail sales data is noisy as it includes commercial purchases of park-owned homes after a manufactured home property is sold to a new buyer, but there was a clear downward trend in total transactions in the higher interest rate environment from 2022 through 2024 and have been roughly flat since.
| Used Sales | Singles | Multis | Total |
|---|---|---|---|
| Total for 2026 titled to date: | 920 | 512 | 1,432 |
| Change from 2025 (%): | -3.4% | 26.7% | 5.6% |
| Change from 2025 (Units): | -32 | 108 | 76 |
Revised Monthly Totals
Because titles continue to come in for past sales months, here are the prior 12 months and what their current sales totals are at this report release.
| New Sales Month | Singles | Multis | Total | (YoY%) |
|---|---|---|---|---|
| March 2026 | 504 | 796 | 1,300 | -8.9 |
| February 2026 | 421 | 670 | 1,091 | -1.6 |
| January 2026 | 390 | 574 | 964 | -3.2 |
| December 2025 | 521 | 760 | 1,281 | 11.6 |
| November 2025 | 416 | 710 | 1,126 | -10.3 |
| October 2025 | 506 | 814 | 1,320 | -5.2 |
| September 2025 | 521 | 763 | 1,284 | -2.4 |
| August 2025 | 535 | 936 | 1,471 | -0.1 |
| July 2025 | 547 | 779 | 1,326 | 2.2 |
| June 2025 | 506 | 637 | 1,143 | -15.0 |
| May 2025 | 592 | 789 | 1,381 | -3.2 |
| April 2025 | 610 | 865 | 1,475 | -6.8 |
| Used Sales Month | Singles | Multis | Total | (YoY%) |
|---|---|---|---|---|
| March 2026 | 160 | 116 | 276 | -22.7 |
| February 2026 | 222 | 99 | 321 | 54.3 |
| January 2026 | 161 | 77 | 238 | 1.3 |
| December 2025 | 191 | 122 | 313 | -18.9 |
| November 2025 | 154 | 88 | 242 | -5.8 |
| October 2025 | 251 | 112 | 363 | -2.4 |
| September 2025 | 163 | 98 | 261 | -2.6 |
| August 2025 | 180 | 95 | 275 | -13.2 |
| July 2025 | 197 | 94 | 291 | 12.8 |
| June 2025 | 176 | 93 | 269 | 18.5 |
| May 2025 | 197 | 94 | 291 | -12.3 |
| April 2025 | 252 | 89 | 341 | 15.2 |