Do Manufactured Homes Appreciate? - FHFA House Price Index Analysis
Manufactured homes titled as real property have appreciated as fast as site-built homes since 2000, according to the Federal Housing Finance Agency's repeat-sales index.
Rob Ripperda
The Federal Housing Finance Agency (FHFA) publishes a house price index for manufactured homes alongside its long-running site-built indices. It is built the same way as the headline FHFA House Price Index, from repeat sales of the same homes, but using only mortgages that Fannie Mae and Freddie Mac acquired on manufactured homes titled as real property. It answers the question lenders, appraisers and local officials ask constantly: do manufactured homes on owned land hold their value the way site-built homes do?
Through 2026 Q2, the manufactured-home index stands at 326.0 on a 2000 Q1 = 100 base, up 226% since 2000, against 324.8 and 225% for site-built homes nationally. Over the past year manufactured-home prices rose 2.3% while site-built prices rose 2.1%.
After trailing site-built homes for most of the 2000s and 2010s, the manufactured-home line has caught up and edged past site-built over the past decade.
Manufactured vs. Site-Built Home Prices Since 2000
Both lines are rebased so that the first quarter of 2000 equals 100. The purchase-only index uses sales prices only. The all-transactions index adds appraisal values from refinances.
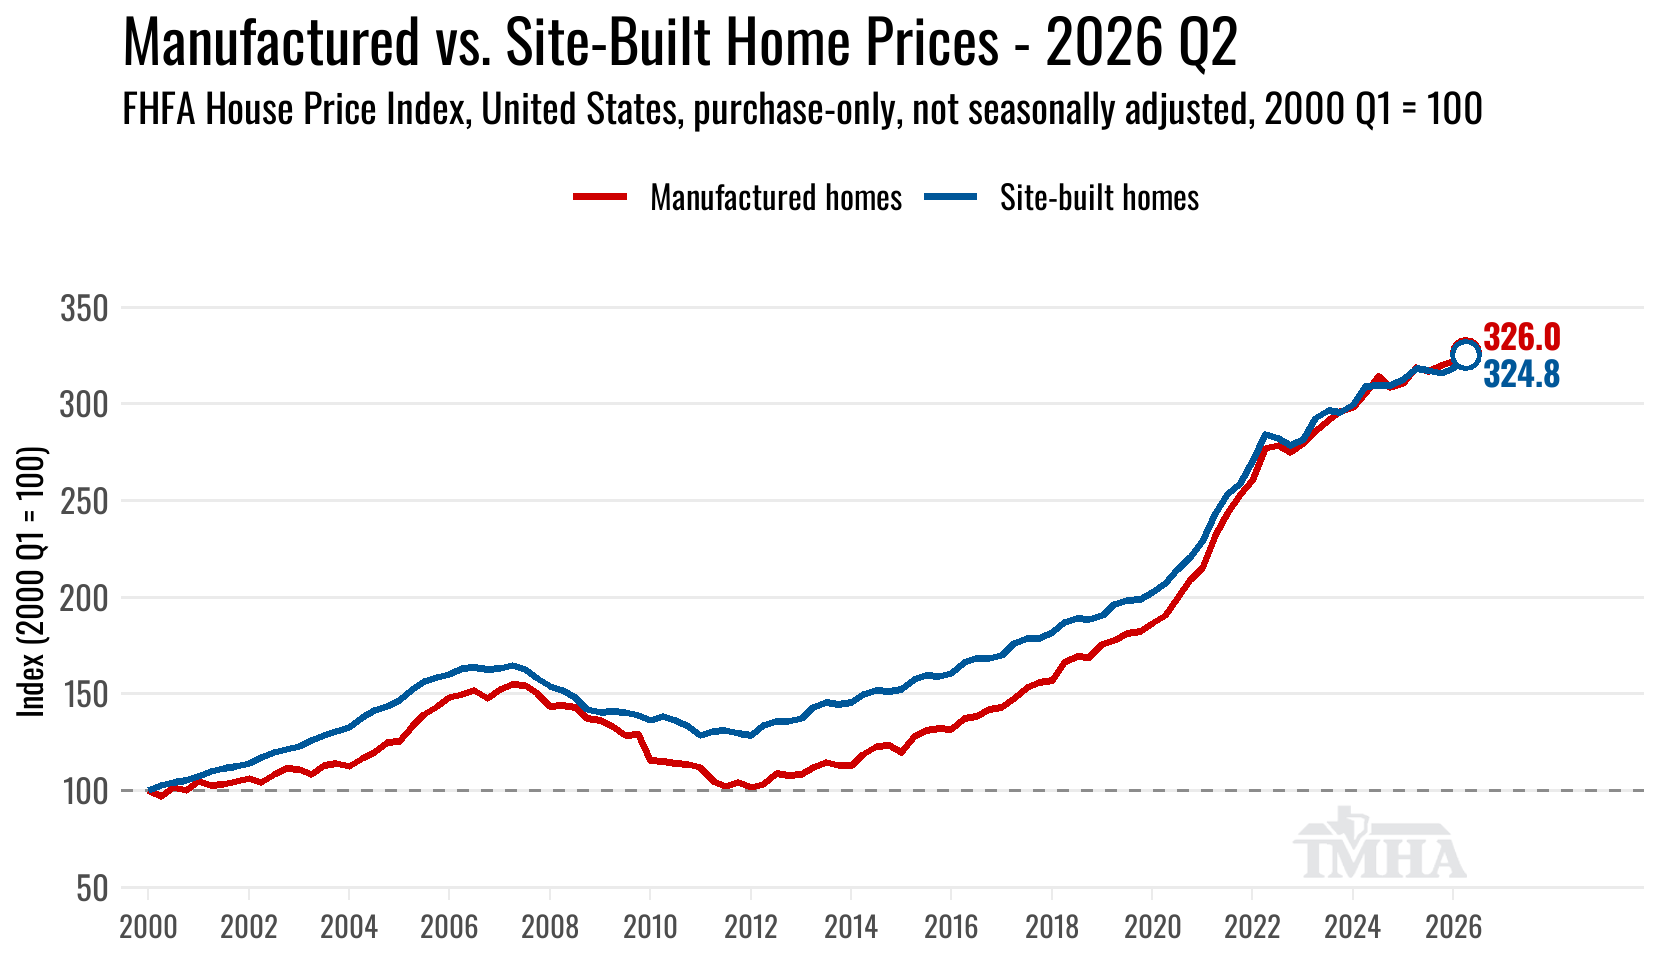
This chart is built from the FHFA House Price Index master file (quarterly, not seasonally adjusted). The manufactured-home index is developmental and covers GSE-acquired loans on manufactured homes titled as real property only.
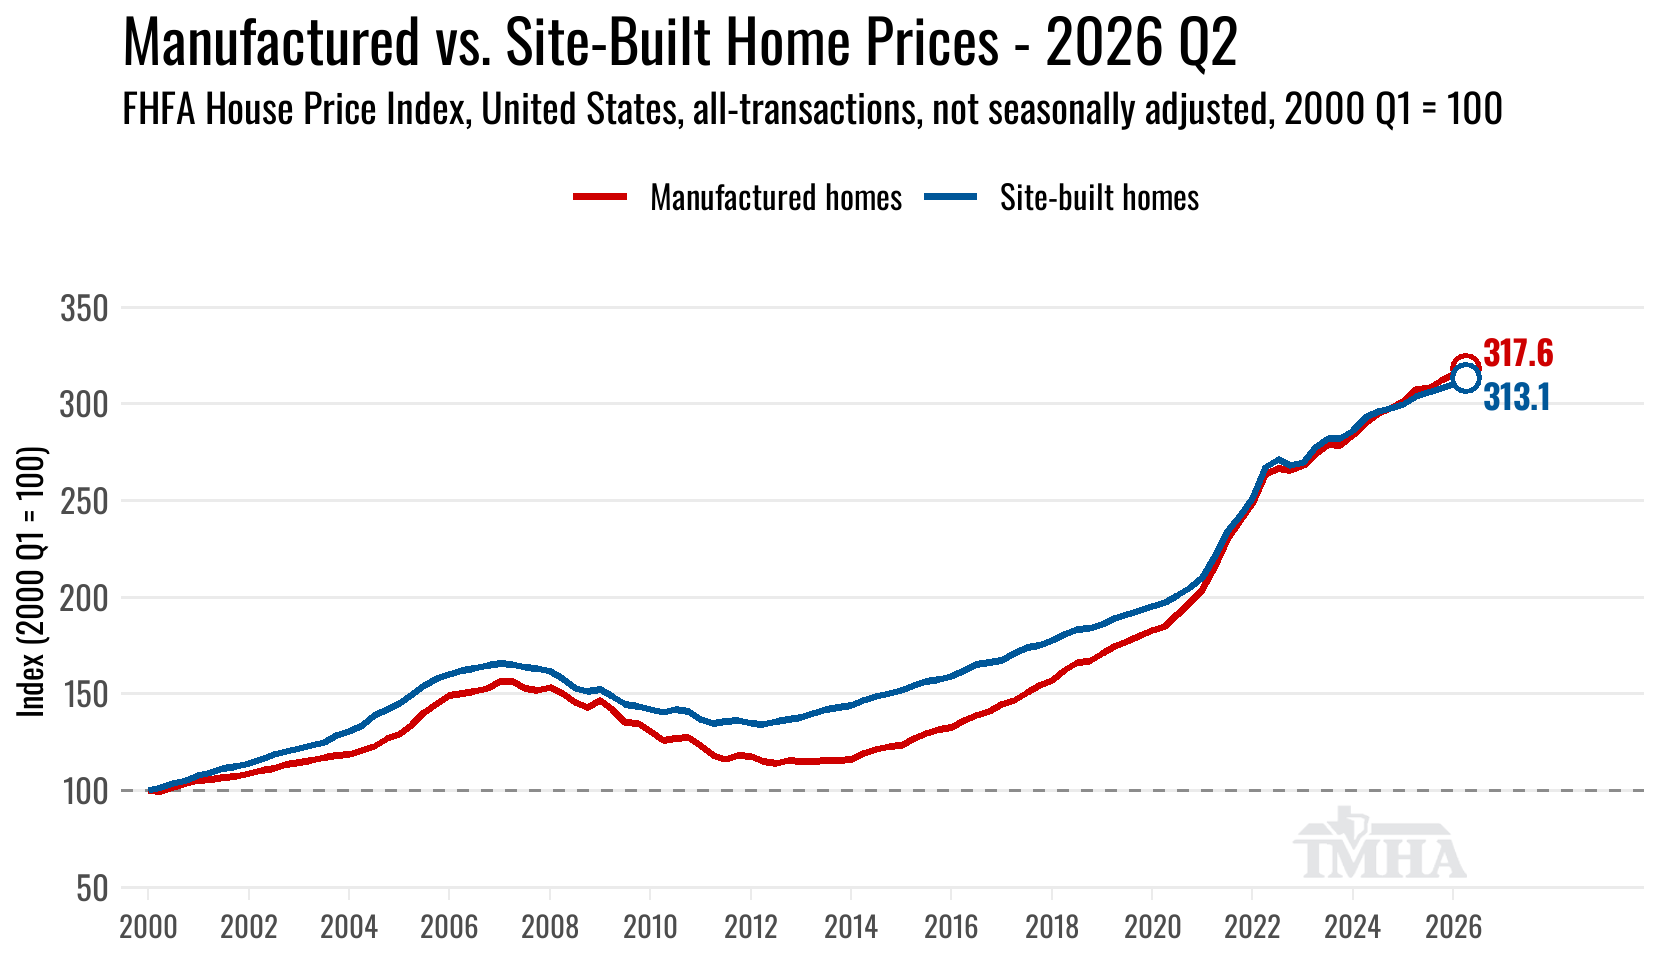
This chart is built from the FHFA House Price Index master file (quarterly, not seasonally adjusted). The all-transactions index adds appraisal values from refinance mortgages to the purchase-only sales pairs.
Why the Index Started Behind
The index begins in 2000, at the top of the largest run of manufactured-home production since the 1970s. Nationally, shipments peaked at 372,843 homes in 1998 and fell to 130,802 by 2004 as the chattel lenders behind the boom failed and their repossessions came back onto the market. Texas still carries that build on its title rolls: the state has roughly 40,000 homes a year from each of 1996 through 1999 against about 10,000 a year from 2009 through 2015, four times the cohort size.
For the index’s first decade, every resale of a financed manufactured home was priced against that glut of young used homes, which likely weighed on the indexed prices. The early readings also rest on very few sales. FHFA’s technical note reports that the index’s first quarter is built from just 13 repeat-sale pairs, against 693 in the second quarter of 2024, which is why the agency labels the series developmental. The housing bust that followed also cut deeper in the manufactured-home index: prices fell 34.5% from their 2007 Q2 peak against 21.9% for site-built homes, and did not regain that peak until 2017 Q4, six quarters after site-built homes did. The starting line, in other words, was set by a glut of homes and a trickle of data rather than by anything inherent to the product, and once that cohort aged out of the resale market the two lines converged.
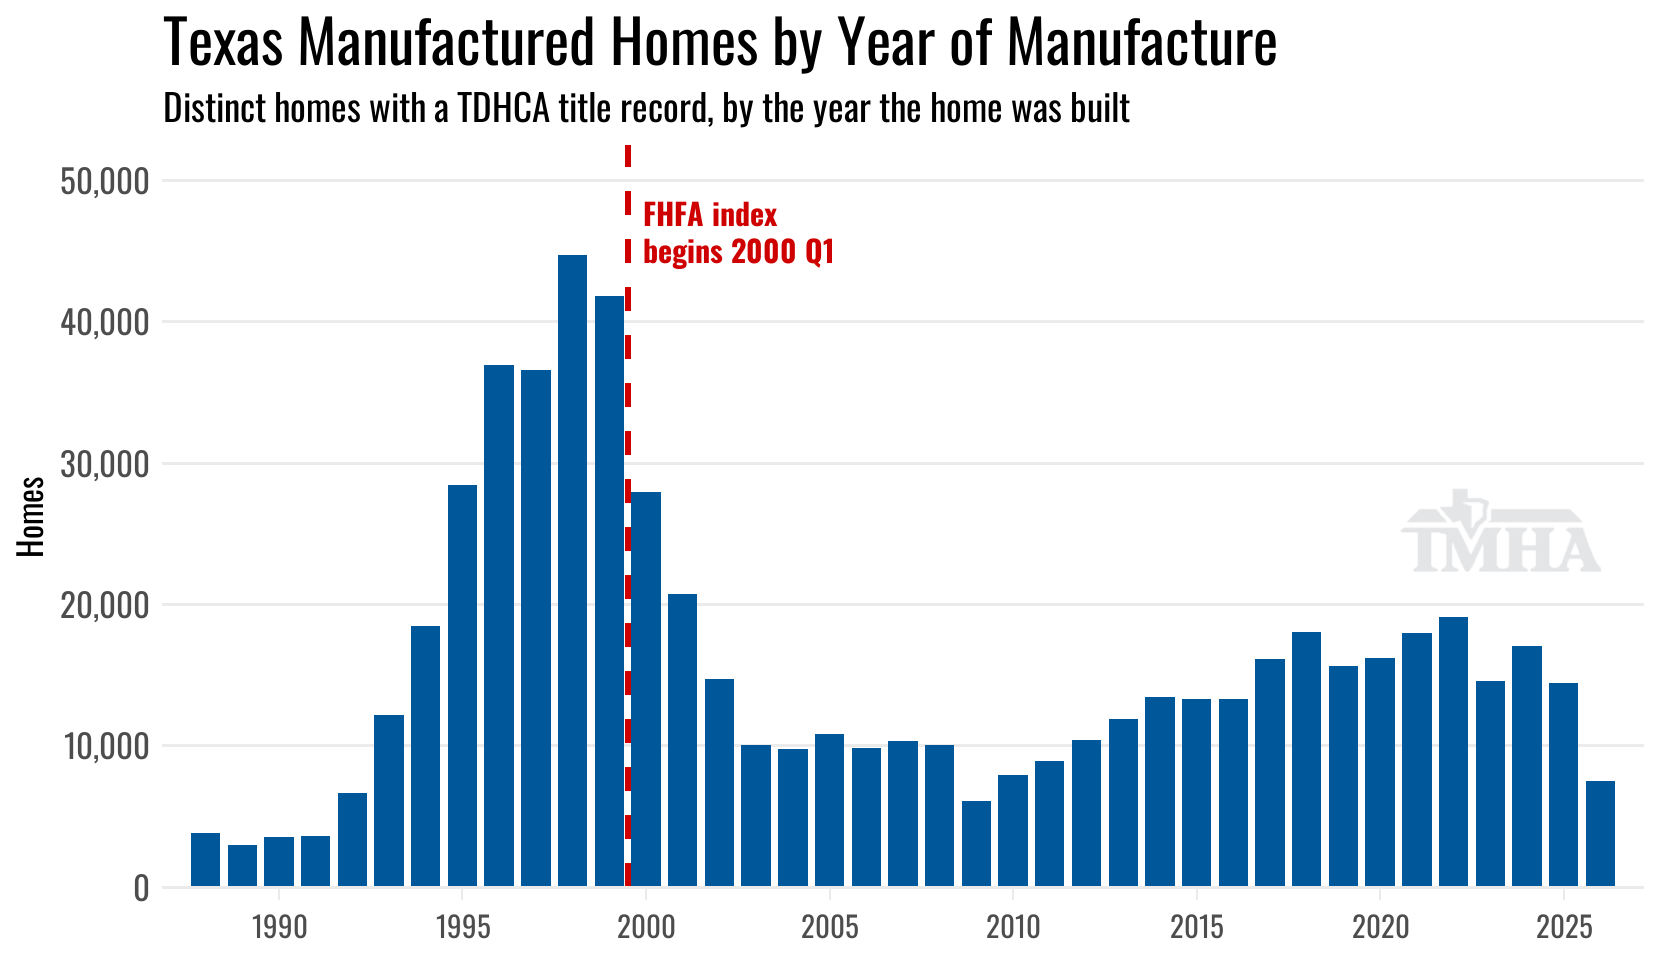
This chart is built from TDHCA Statements of Ownership and Location, one row per home, with the year of manufacture taken from the certificate (or estimated from the HUD label sequence for older homes). It counts homes that still carry a title record today, so the oldest cohorts are undercounted and the 2026 bar is a partial year. National shipment figures are from the Manufactured Housing Institute. Title data pulled November 02, 2026.
Growth Has Run Ahead of Site-Built Since 2015
The catch-up came after the bust. From 2015 to 2020 the manufactured-home index compounded at 9.3% a year against 5.9% for site-built homes, and from the start of 2020 through 2026 Q2 it has run at 9.4% a year against 7.9%. Since the second quarter of 2022, when mortgage rates jumped and site-built appreciation slowed, manufactured homes have appreciated 4.2% a year against 3.4%. Over the full span since 2000 the two are even at about 4.6% a year.
The all-transactions versions tell the same story, with manufactured homes up 3.3% over the past year against 3.0% for site-built.
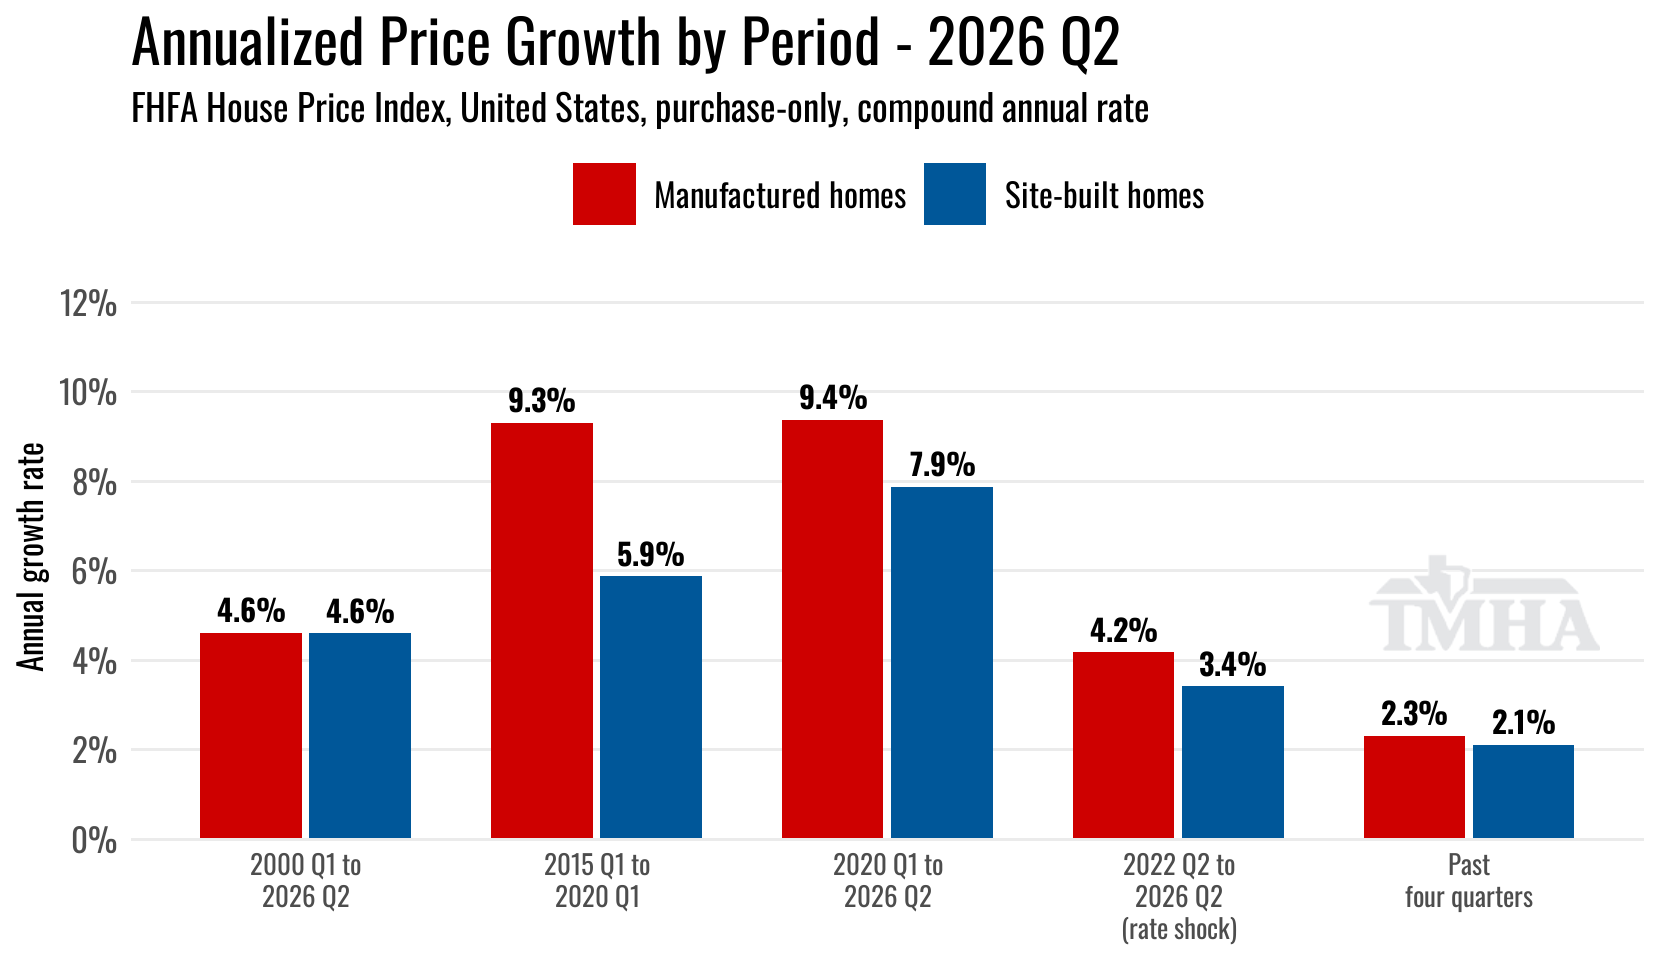
This chart is built from the FHFA House Price Index master file. Rates are compound annual growth between the first and last quarter of each window; the final bar is the simple change over the latest four quarters.
About the Index
FHFA’s manufactured-home index is labeled developmental: it is published in the HPI master file as a national, quarterly, not-seasonally-adjusted series with 2000 Q1 = 100, and FHFA may revise its construction. It is estimated from repeat transactions on manufactured homes with conventional mortgages acquired by Fannie Mae or Freddie Mac, which means the home sits on land the borrower owns and is titled as real property. Chattel-financed homes, FHA and VA loans, and homes in land-lease communities are outside it. The site-built comparison lines are FHFA’s standard purchase-only and all-transactions indices for the United States, rebased here to the same 2000 Q1 starting point.
FHFA releases the quarterly index about eight weeks after each quarter ends. This post was built from the master file pulled November 02, 2026.