Texas Manufactured Home Shipments Market Analysis
February Shipments
Manufactured home shipments to Texas retailers in February moved up a seasonally-adjusted +0.4% from the previous month as deliveries per production day picked up. The 1,441 total homes shipped for the month was on the high side of the forecast but was down -5.4% from the 29-day February of 2024. Multi-section home shipments were actually up +6.2% despite the lower number of production days, but single-sections were down -18.5%.
| Shipments | Singles | Multis | Total |
|---|---|---|---|
| Total for February: | 582 | 859 | 1,441 |
| Change from January (Raw %): | -4% | -6.3% | -5.4% |
| Change from January (Raw Units): | -24 | -58 | -82 |
| Change from January (SA %): | 2.6% | -0.1% | 0.4% |
| Change from February of 2024 (%): | -18.5% | 6.2% | -5.4% |
| Change from February of 2024 (Units): | -132 | 50 | -82 |
February Production
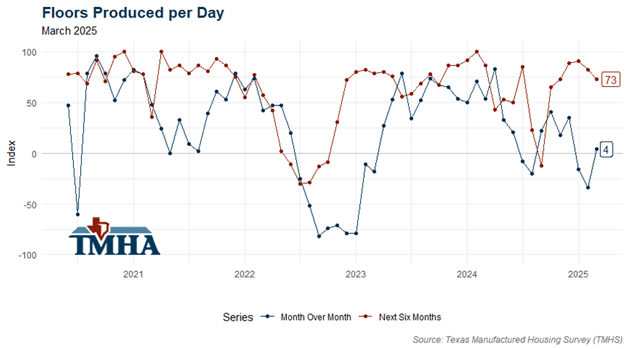
Texas manufactured housing plant production also expanded moving up a seasonally-adjusted +1% over January, despite the Texas Manufactured Housing Survey indicating a reduction in run rates for the month. The 1,812 homes produced was also in the high side of the total home forecast but was -7.2% below February of 2024. The run rates for both total homes and floors moved up from January by +3%.
| Texas Plant Production | Total | Shipped Out of TX | Min Floors |
|---|---|---|---|
| Total for February: | 1,812 | 462 | 2,605 |
| Change from January (Raw %): | -6% | -9.6% | -6% |
| Change from January (Raw Units): | -115 | -49 | -165 |
| Change from January (SA %): | 1% | NA | 0% |
| Change from February of 2024 (%): | -7.2% | -9.1% | -3.8% |
| Change from February of 2024 (Units): | -141 | -46 | -102 |
March Outlook
The forecasting models have March shipments at 1,560 (+/- 224) and Texas factory production at 1,884 (+/- 225) homes.
The Texas Manufactured Housing Survey (TMHS) for March has run rates holding at current levels, but the response rates were lower which increases uncertainty in which direction production is headed.
Annual Totals
The shipment total for the year is currently -0.3% below 2024 as is Texas plant production. The floor data is actually up +3.8% as multi-section demand remains strong.
The forecast for annual Texas shipments in 2025 moved down to 18,235 (+/- 2,977) but forecasted Texas plant production moved up to 23,454 (+/- 3,242).
| Shipments | Singles | Multis | Total |
|---|---|---|---|
| Total for 2025 YTD: | 1,188 | 1,776 | 2,964 |
| Change from 2024 (%): | -16.7% | 14.8% | -0.3% |
| Change from 2024 (Units): | -239 | 229 | -10 |
| Texas Plant Production | Total | Shipped Out of TX | Min Floors |
|---|---|---|---|
| Total for 2025 YTD: | 3,739 | 973 | 5,375 |
| Change from 2024 (%): | -0.3% | 2% | 3.8% |
| Change from 2024 (Units): | -10 | 19 | 199 |
Charts
January 2025 could be the 12-month moving average peak for shipments this production cycle, February shipments were solid but trailed the leap year of 2024. The forecast for March would put the 12-MA moving sideways next month.